NIST RPKI Monitor 2.0
Methodology and User's Guide
Overview
NIST is working with the industry to design, standardize and foster commercialization and deployment of technologies to improve the resilience of Internet routing. NIST’s Robust Inter-Domain Routing project is part of a larger Trustworthy Networking program focused on the research and development of technologies necessary to increase the security, privacy, and robustness of networked systems.
Border Gateway Protocol (BGP) origin validation based upon the Resource Public Key Infrastructure (RPKI) data is one such technology that has transitioned into the adoption and deployment phase. The RPKI is a globally operated X.509-based trust infrastructure that permits address owners to declare the networks authorized to announce their prefixes in BGP. Network operators can download global RPKI data and use these declared Route Origin Authorizations (ROAs) to filter unauthorized BGP announcements, thus preventing malicious route-hijacks, misconfigurations, and other routing anomalies.
While RPKI and RPKI-based route origin validation (RPKI-ROV) adoption is growing rapidly, there are still questions to be addressed about the reliability of the underlying technologies and their impact on Internet routing. Both RPKI data and BGP announcements are subject to continuous changes and can experience human errors, system failures, and potentially malicious manipulations.
This NIST RPKI monitor is a test and measurement tool designed to monitor the dynamics of the global RPKI and the impact of RPKI-ROV on Internet routing. Its purpose is to provide measurement data and analyses to the research, standardization, and operations communities necessary to improve the trust and confidence in the underlying technologies.
This is the second version of the NIST RPKI Monitor – developed to add more analysis features for understanding changes in the RPKI-ROV infrastructure. Most of the analysis features of the original NIST RPKI monitor have been migrated to this new platform, but if you are looking for information from the prior version that you can’t find here, the original monitor is available here: rpki-monitor-v1.antd.nist.gov.
What the monitor does not provide
This monitor does not provide information that can be used in network operations, it is strictly designed to only provide statistics and analysis appropriate for input to design and standardization discussions. The monitor does not attempt to measure the extent of deployment of RPKI-ROV in operational networks (that is, which networks are filtering BGP based upon RPKI data).
Discussion and Feedback
There is a public email list for discussing this monitor and its data. This email list will also receive some automated reports from the monitor including a daily statistical summary of significant changes in the RPKI and their potential impact on RPKI-ROV and periodic reports of significant changes or anomalies in the RPKI infrastructure.
To join this discussion list, send an email to:
Disclaimers
All analyses on this site are based upon BGP trace data gathered from the Route Views and RIPE RIS public BGP collectors and repositories. The statistics presented are accurate as applied to that data, but one should note when interpreting the results, that it is possible that the trace data itself may contain BGP updates with forged or modified attributes not intended by the actual originator of the BGP update.
These web pages are provided as a public service by the National Institute of Standards and Technology (NIST). The information presented is based upon publicly available data sets and is expressly provided “AS IS” to support research and understanding of the emerging technologies involved. NIST makes no warranty of any kind on the accuracy of the results presented or the accuracy of the underlying public data sources upon which they rely. See the full statement of the applicable disclaimer.
Acknowledgments
The information presented on these pages is considered public information and may be copied or redistributed. Appropriate credit is requested with any reuse of any of the results presented on this site.
- "NIST RPKI Monitor", National Institute and Standards and Technology, available at https://rpki-monitor.antd.nist.gov.
This system uses other public domain software, services and data including: RouteViews, ARIN, RIPE, APNIC, LACNIC, AFRINIC, RPKI MIRO , CIDR-Report Autonomous System number-to-name mapping.
Overview of the measurements and visualizations provided by the monitor
| RPKI-ROV Analysis |
|
|---|---|
| RPKI Data Analysis |
|
| Announcements |
|
| Reports |
|
Notes
(1) Throughout this report, to see the details and text magnified in any image, please click on the image and it opens in a new tab where it can be expanded. (2) In the bar graphs with 25 ASes, hover over any bar and a text box pops up with validation details for the corresponding AS. (3) In the sunburst graphs, hovering the cursor over any arc segment displays details about that segment in the center circle. If an arc segment is clicked on, then the sunburst is refreshed showing the measurement in that arc segment at the center and its breakout. To go back to the complete sunburst image, click in the center circle (or refresh the page).RPKI-ROV Analysis
| Global Analysis | Displays RPKI-ROV analysis from several perspectives: Global, Per Regional Internet Registry (RIR), comparing RIRs, IPv4/IPv6, temporal. |
|---|---|
| Valid Origination | Displays RPKI-ROV details of routes that are found Valid from several perspectives: Global, Per Regional Internet Registry (RIR), IPv4/IPv6, temporal. |
| Not-Found Origination | Same as above for Not-Found. |
| Invalid Origination | Same as above for Invalid. |
| Coverage of Invalids | For Invalid prefixes, checks if they are covered by announced Valid or Not-Found less specific prefix(es). Displays coverage analysis of invalid prefixes from several perspectives: Global, according to Path details (same/different origin AS, peer AS, etc.), Per Regional Internet Registry (RIR), Per Invalid type (AS mismatch, max-Length exceeded, etc.). |
| ROV Changes | Illustrates RPKI-ROV changes over a user-selected time interval. Time plots of the validation changes and ROA coverage details are revealed when prefixes are clicked on. |
RPKI-ROV Analysis: Global Analysis
RPKI Monitor 2.0 allows users to get multidimensional views of RPKI-ROV data. For this purpose, we provide the end-user with a selection menu. In this menu, we have three main dimensions: Time as date and hour, Regional Internet Registry (RIR), and IPv4/IPv6 Address Family. The selected date must be greater than April 10, 2019, and must not exceed the current calendar date.
Based on the default or the chosen dimensions (the type of analysis, IP address family, Region (RIR), date/time), we display in the description menu shown below a brief indication of the selected ones.

For the global RPKI-ROV analysis, we compare RPKI Route Origin Attestations (ROAs) to the BGP routing announcements. At present, BGP Routeviews data is collected every six hours and hence this analysis is performed at six-hour intervals.
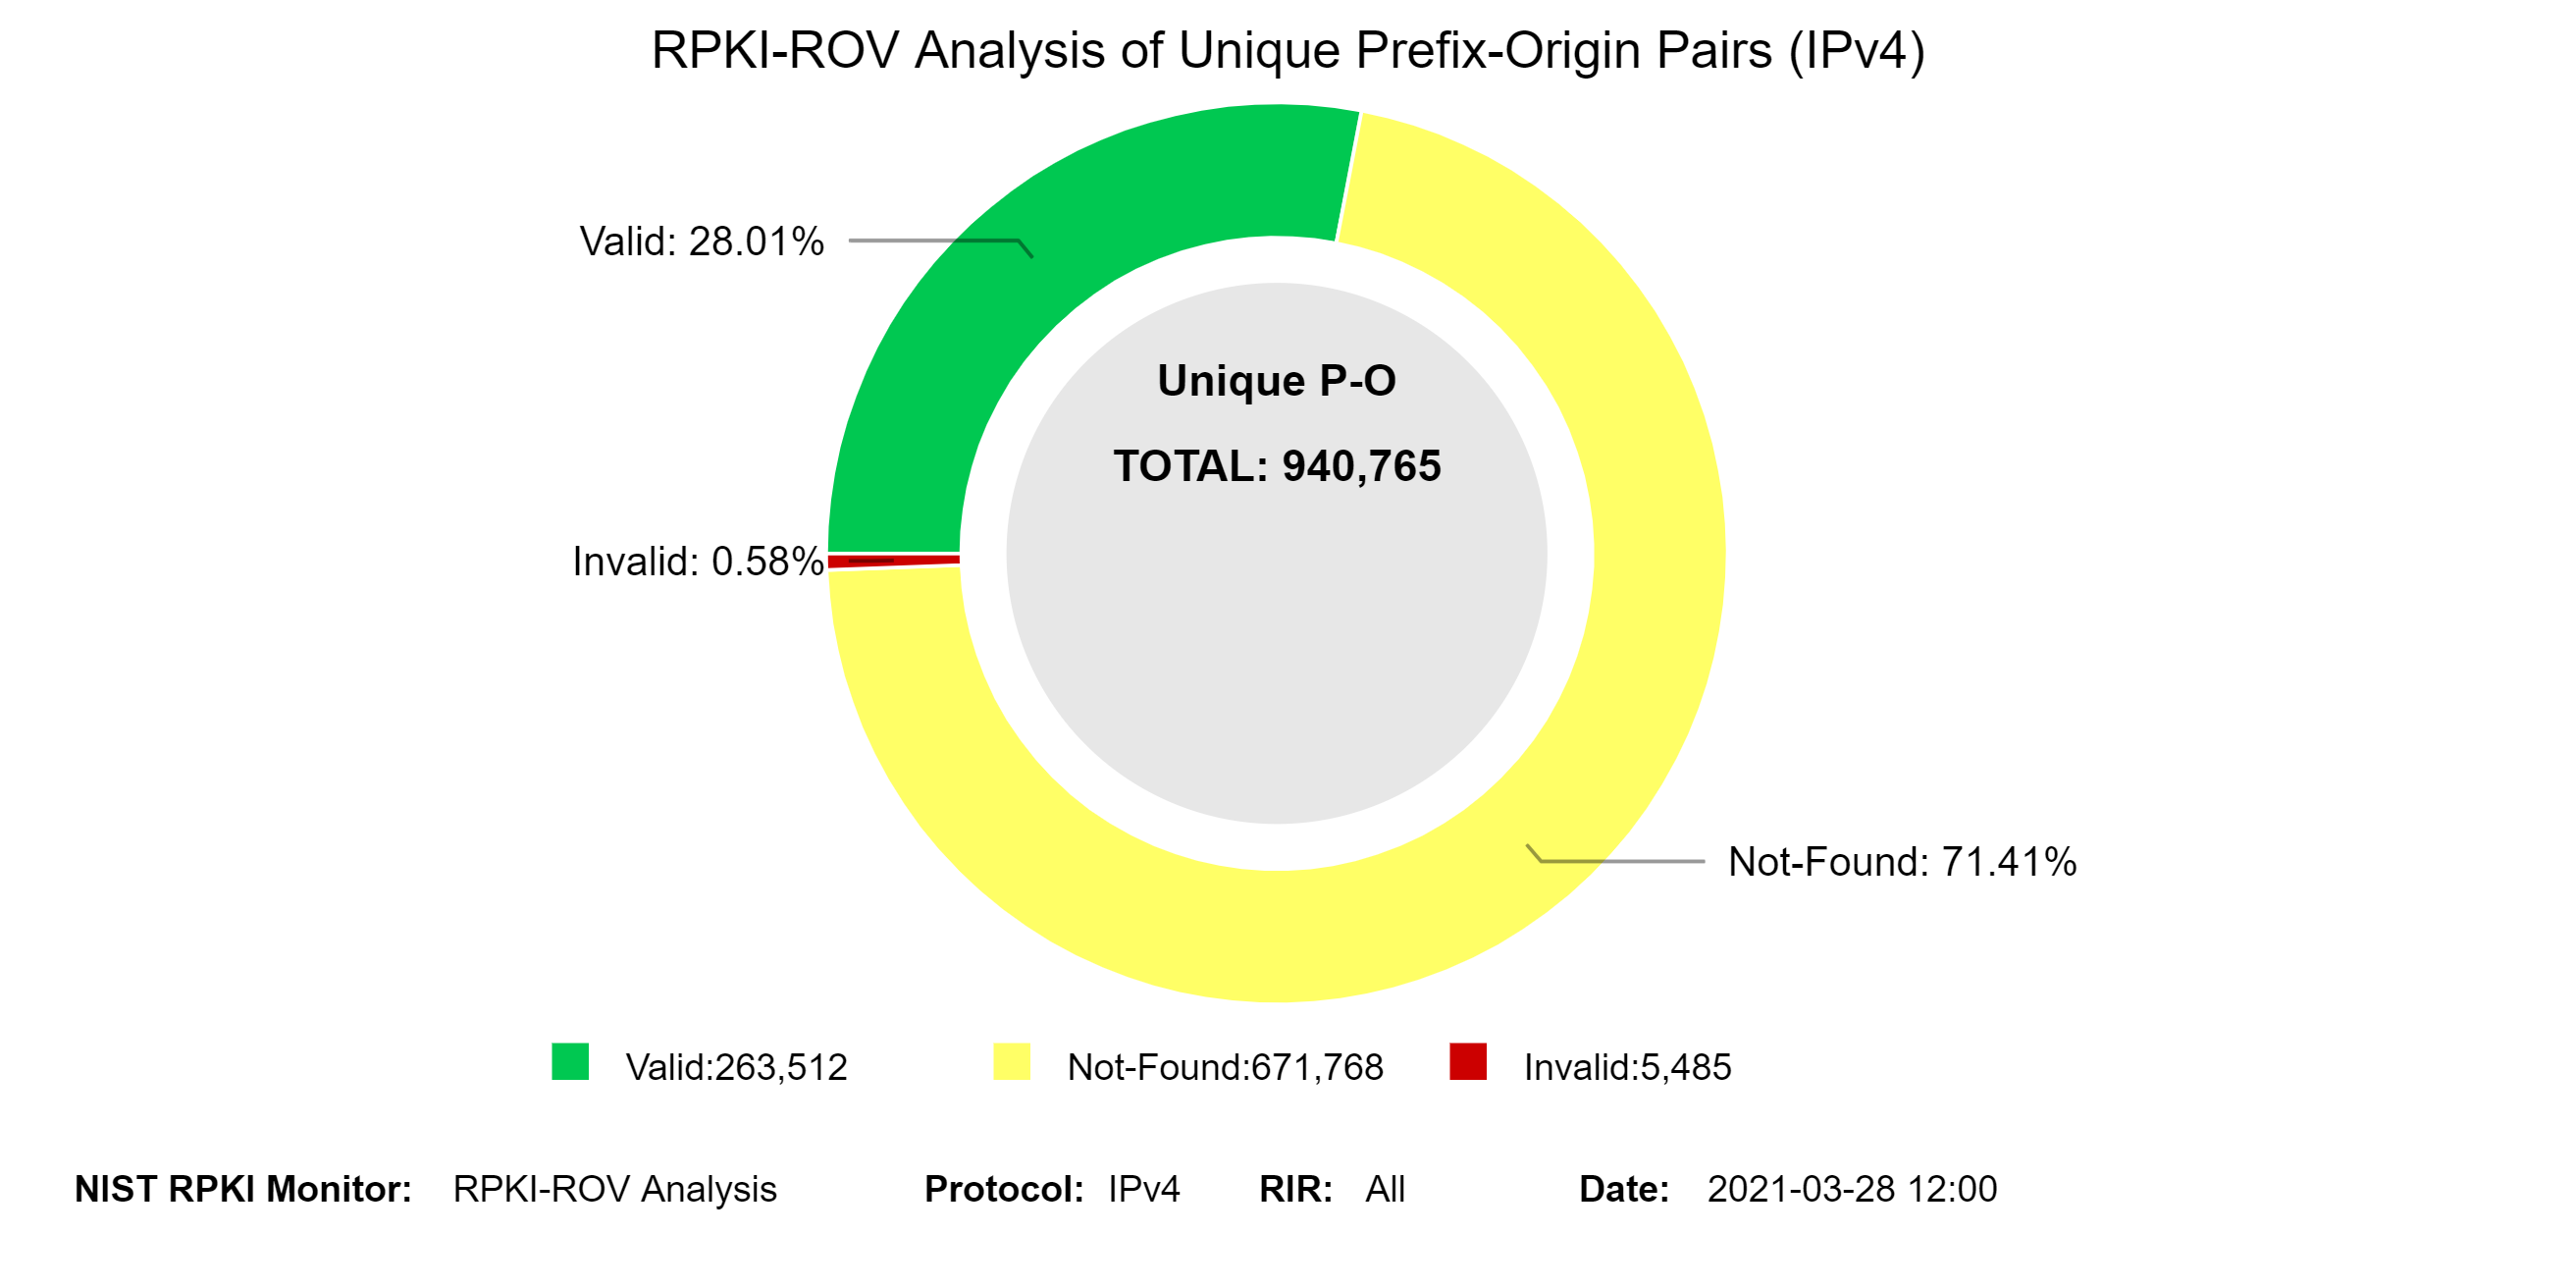
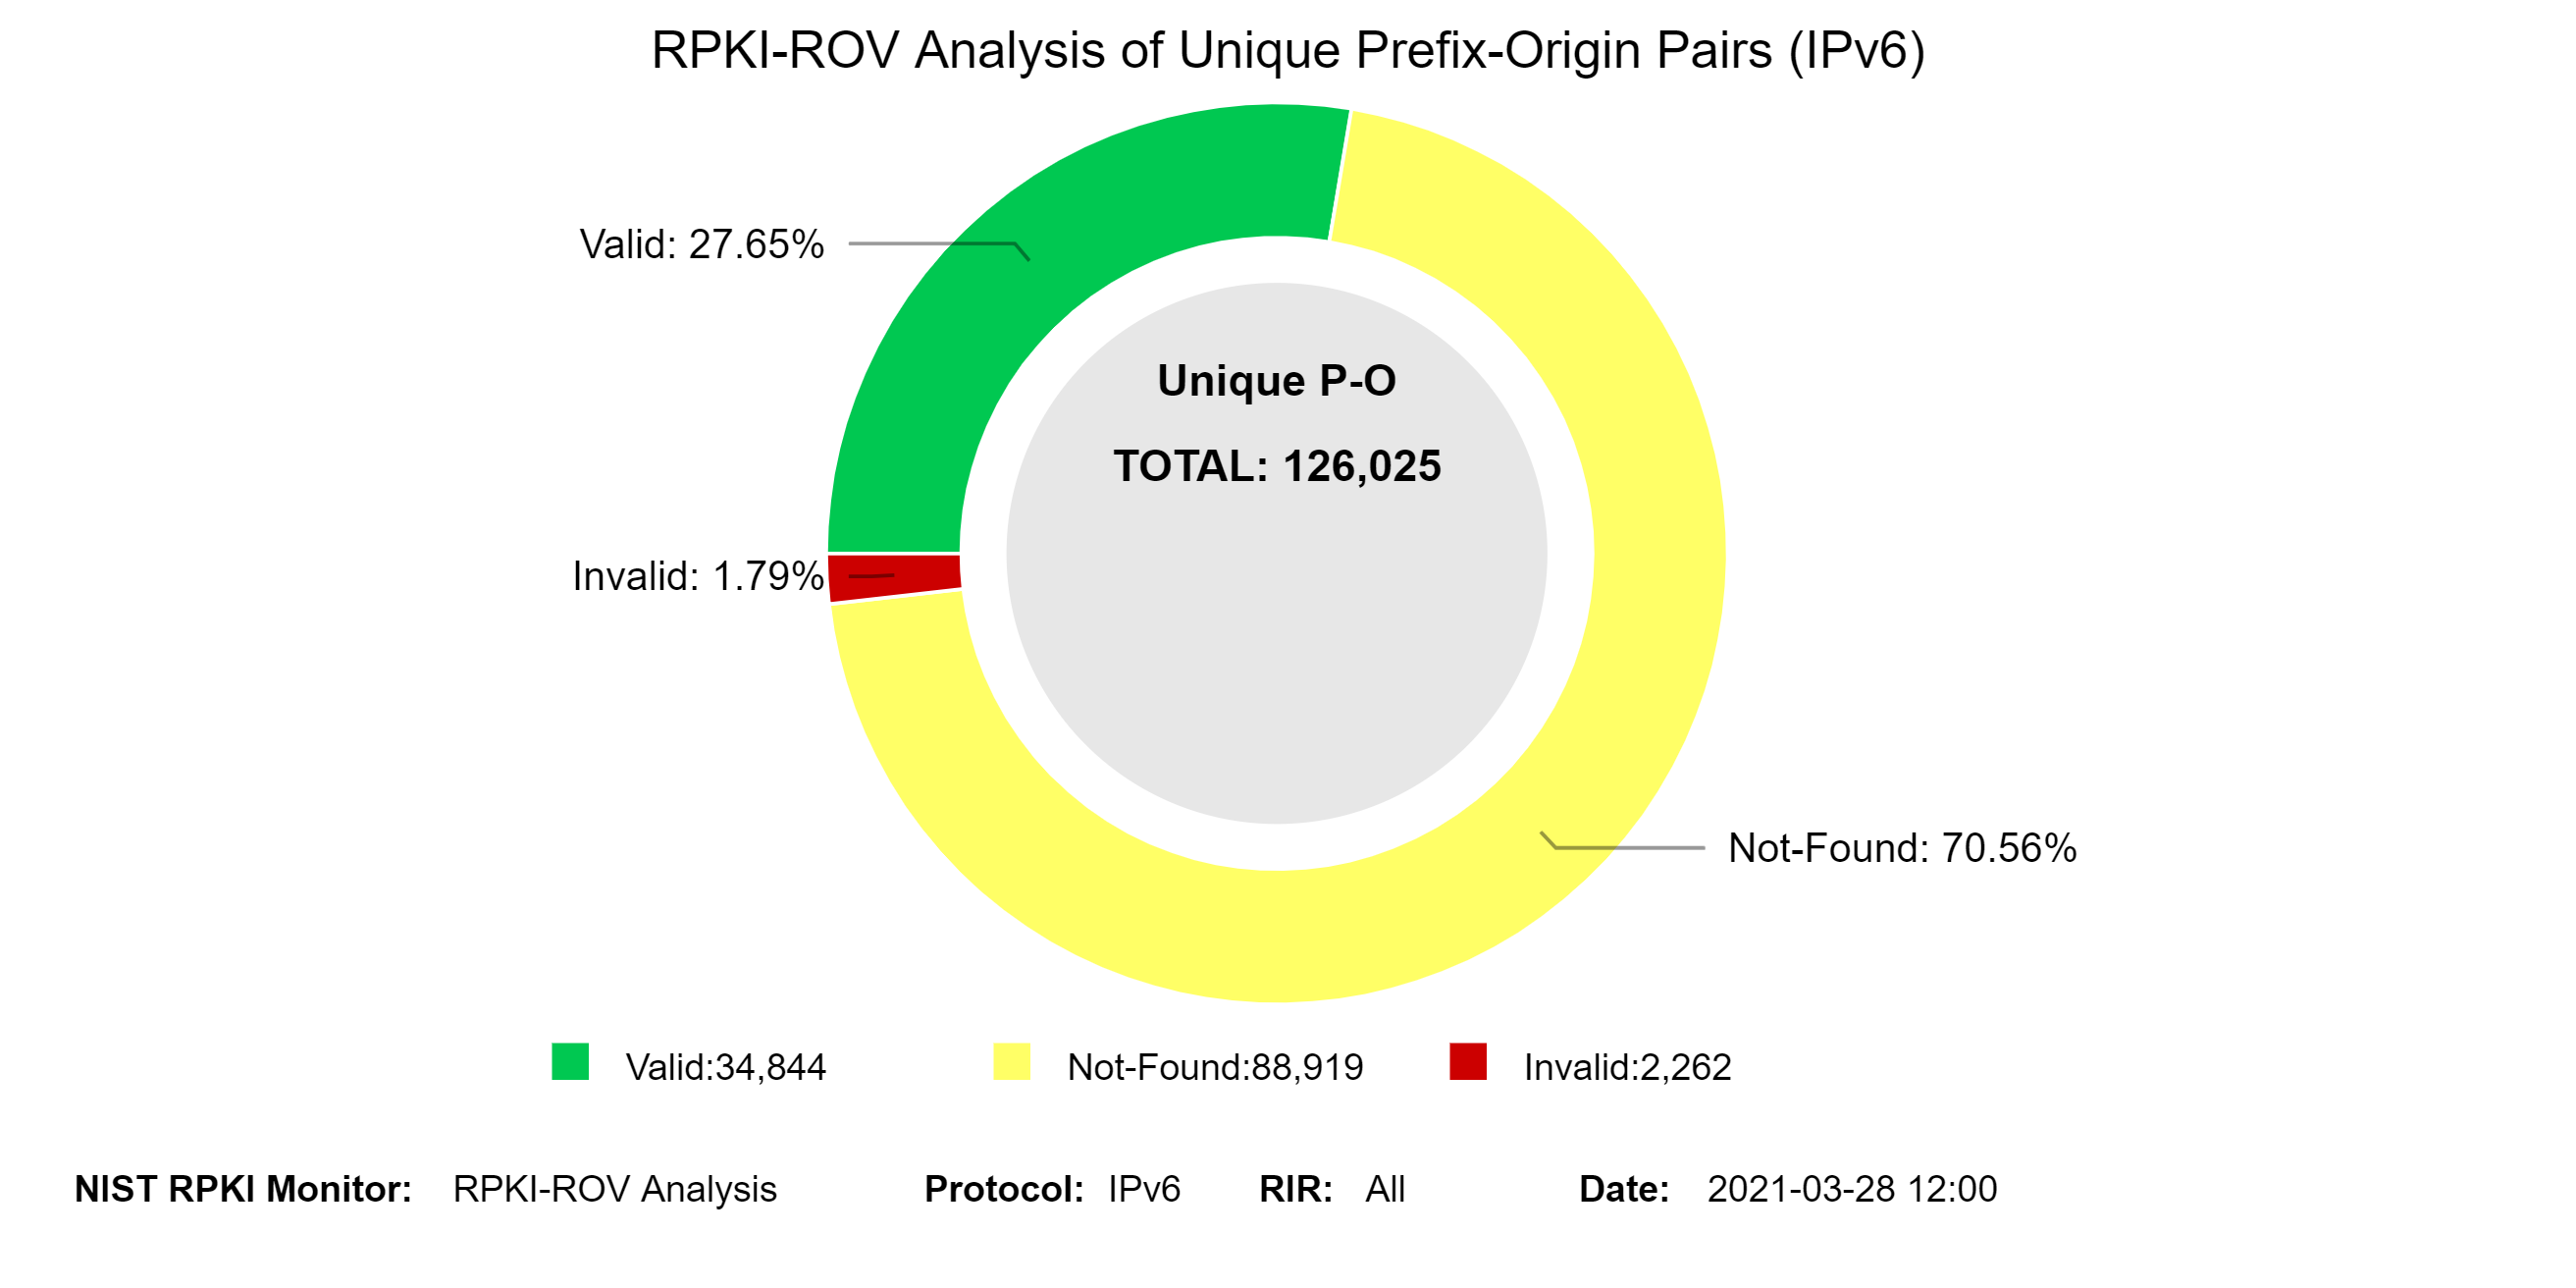
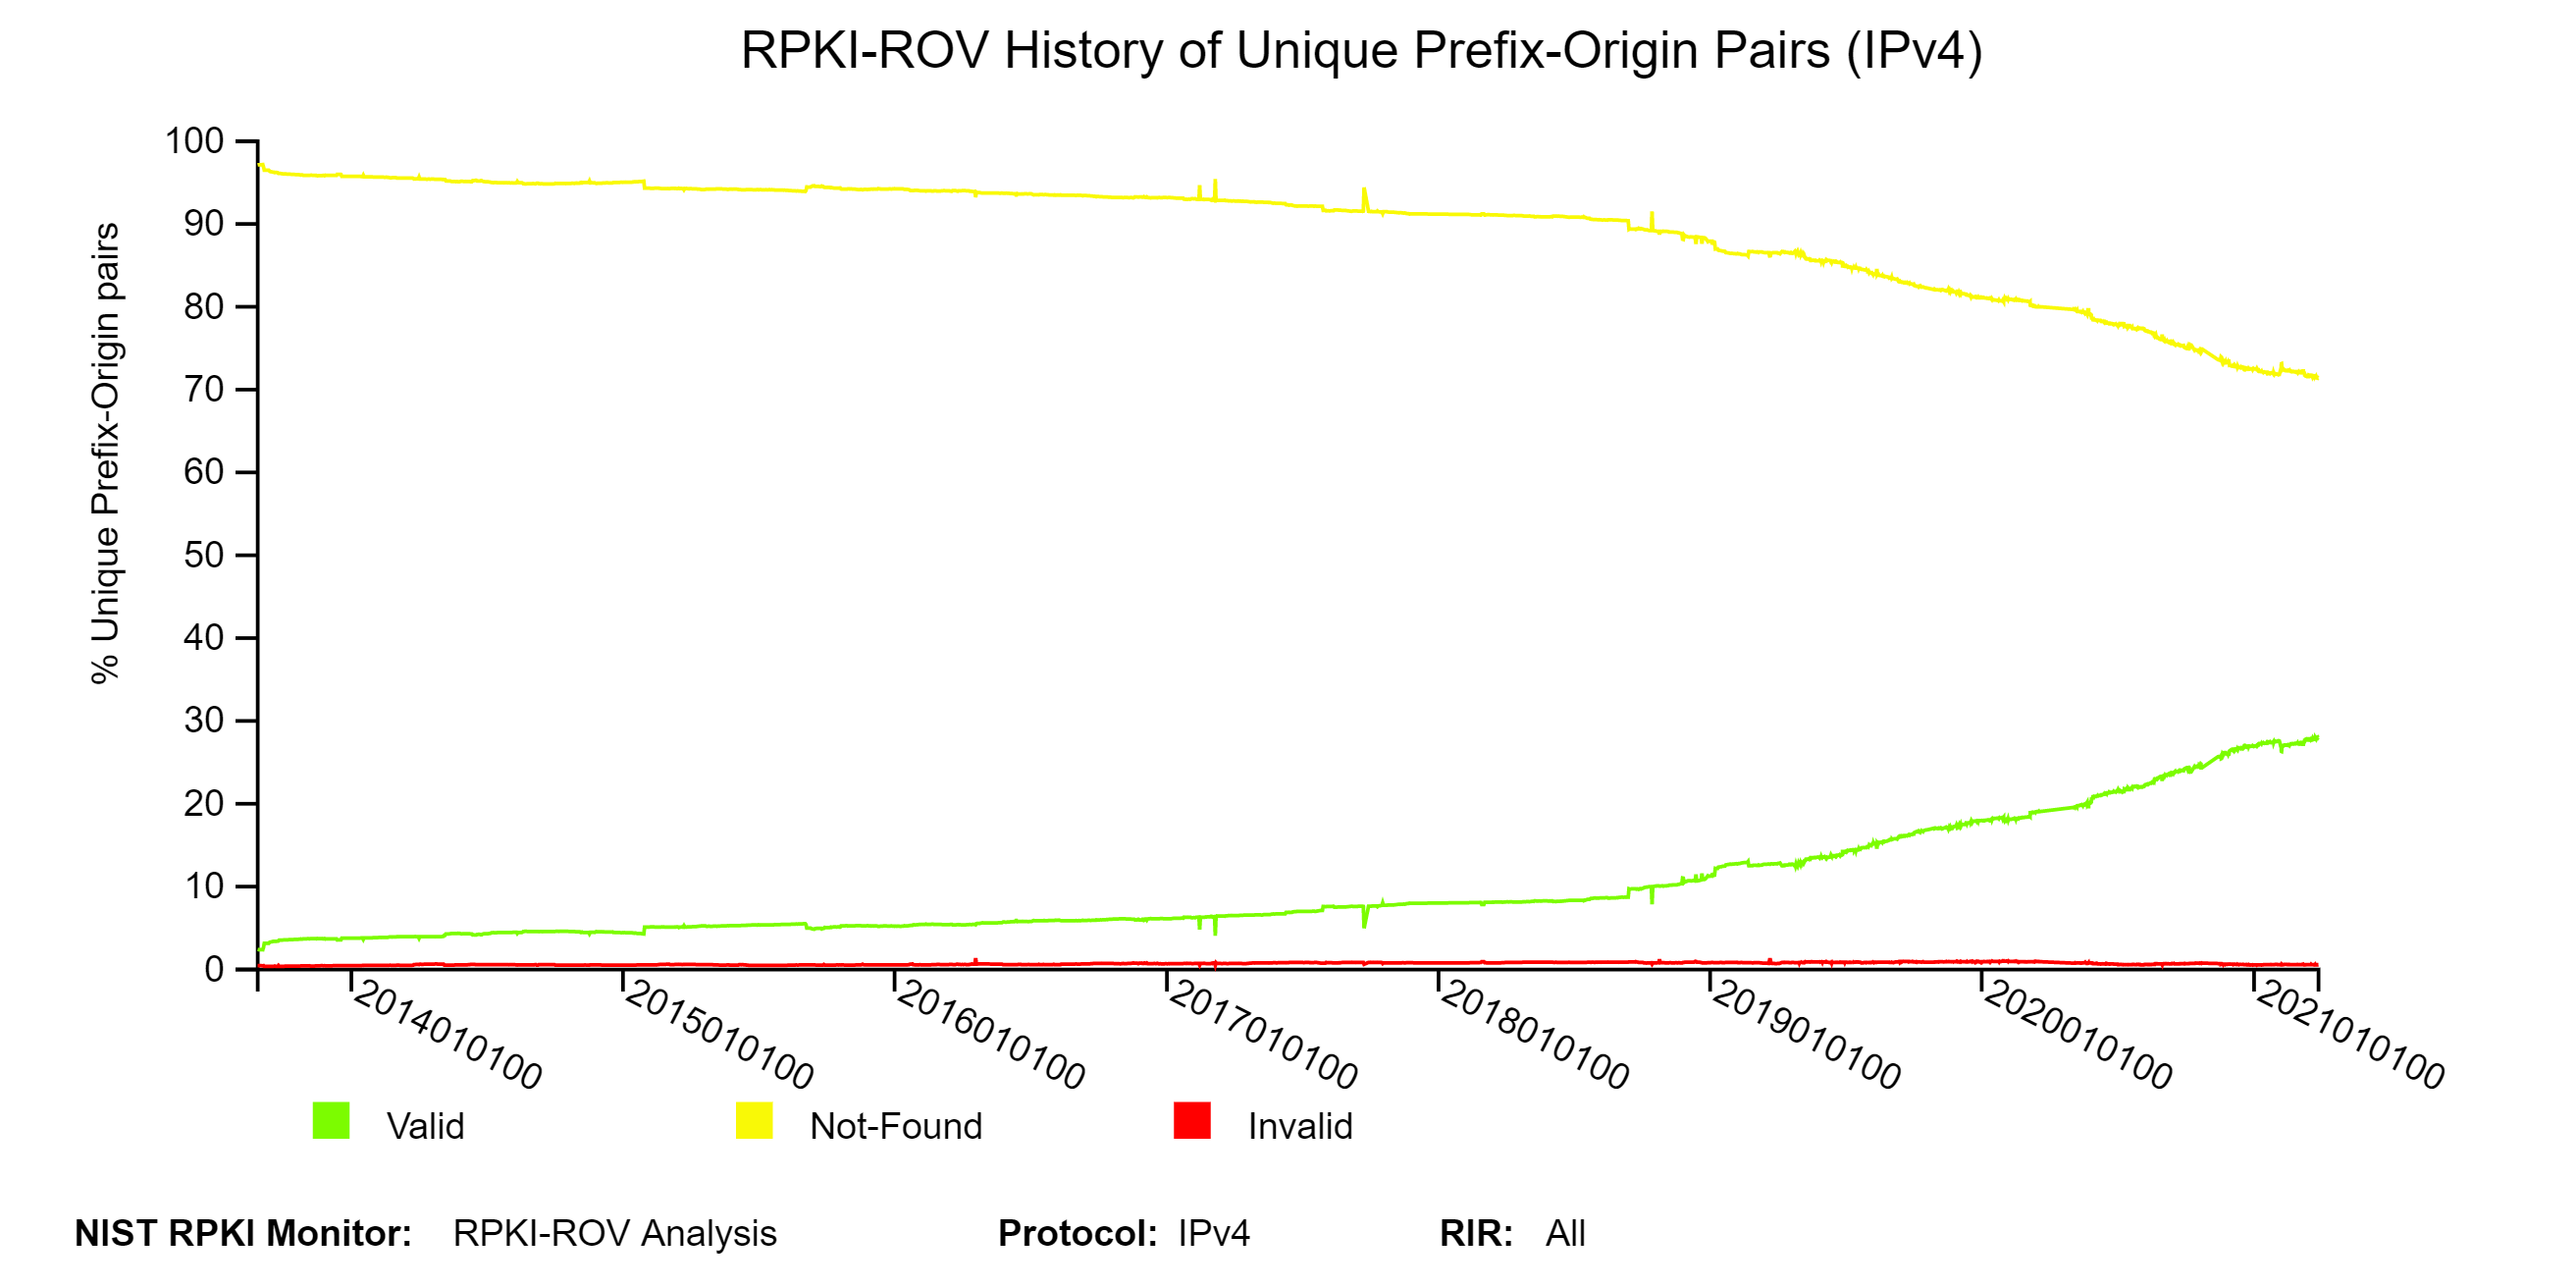
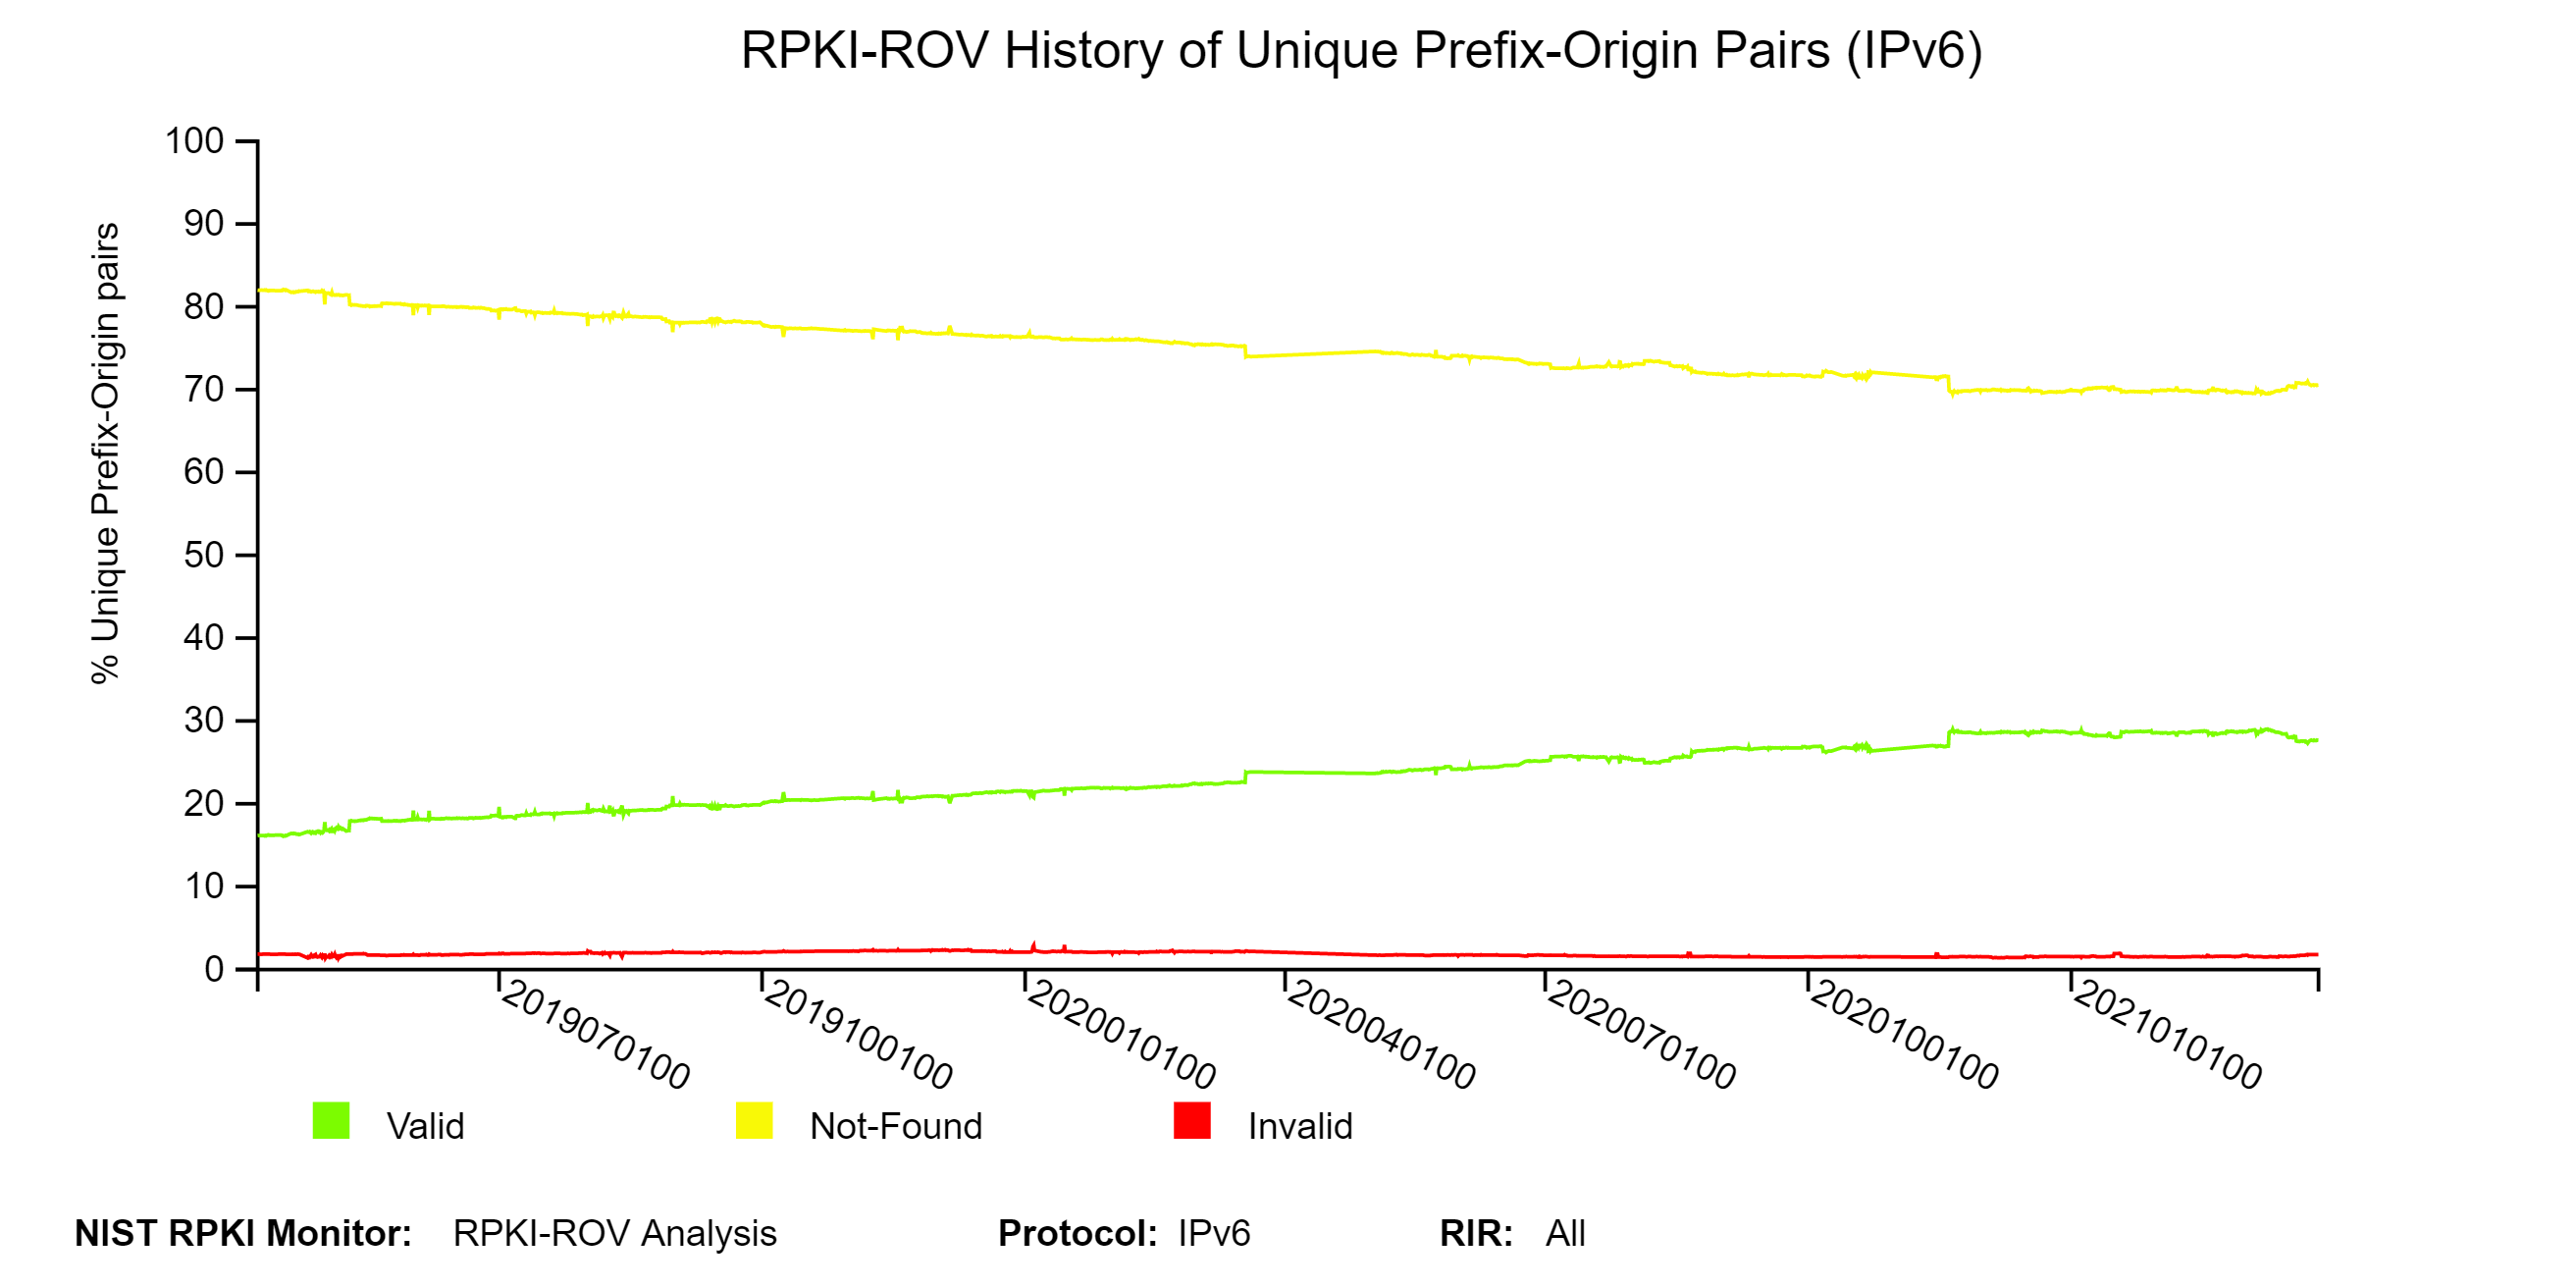
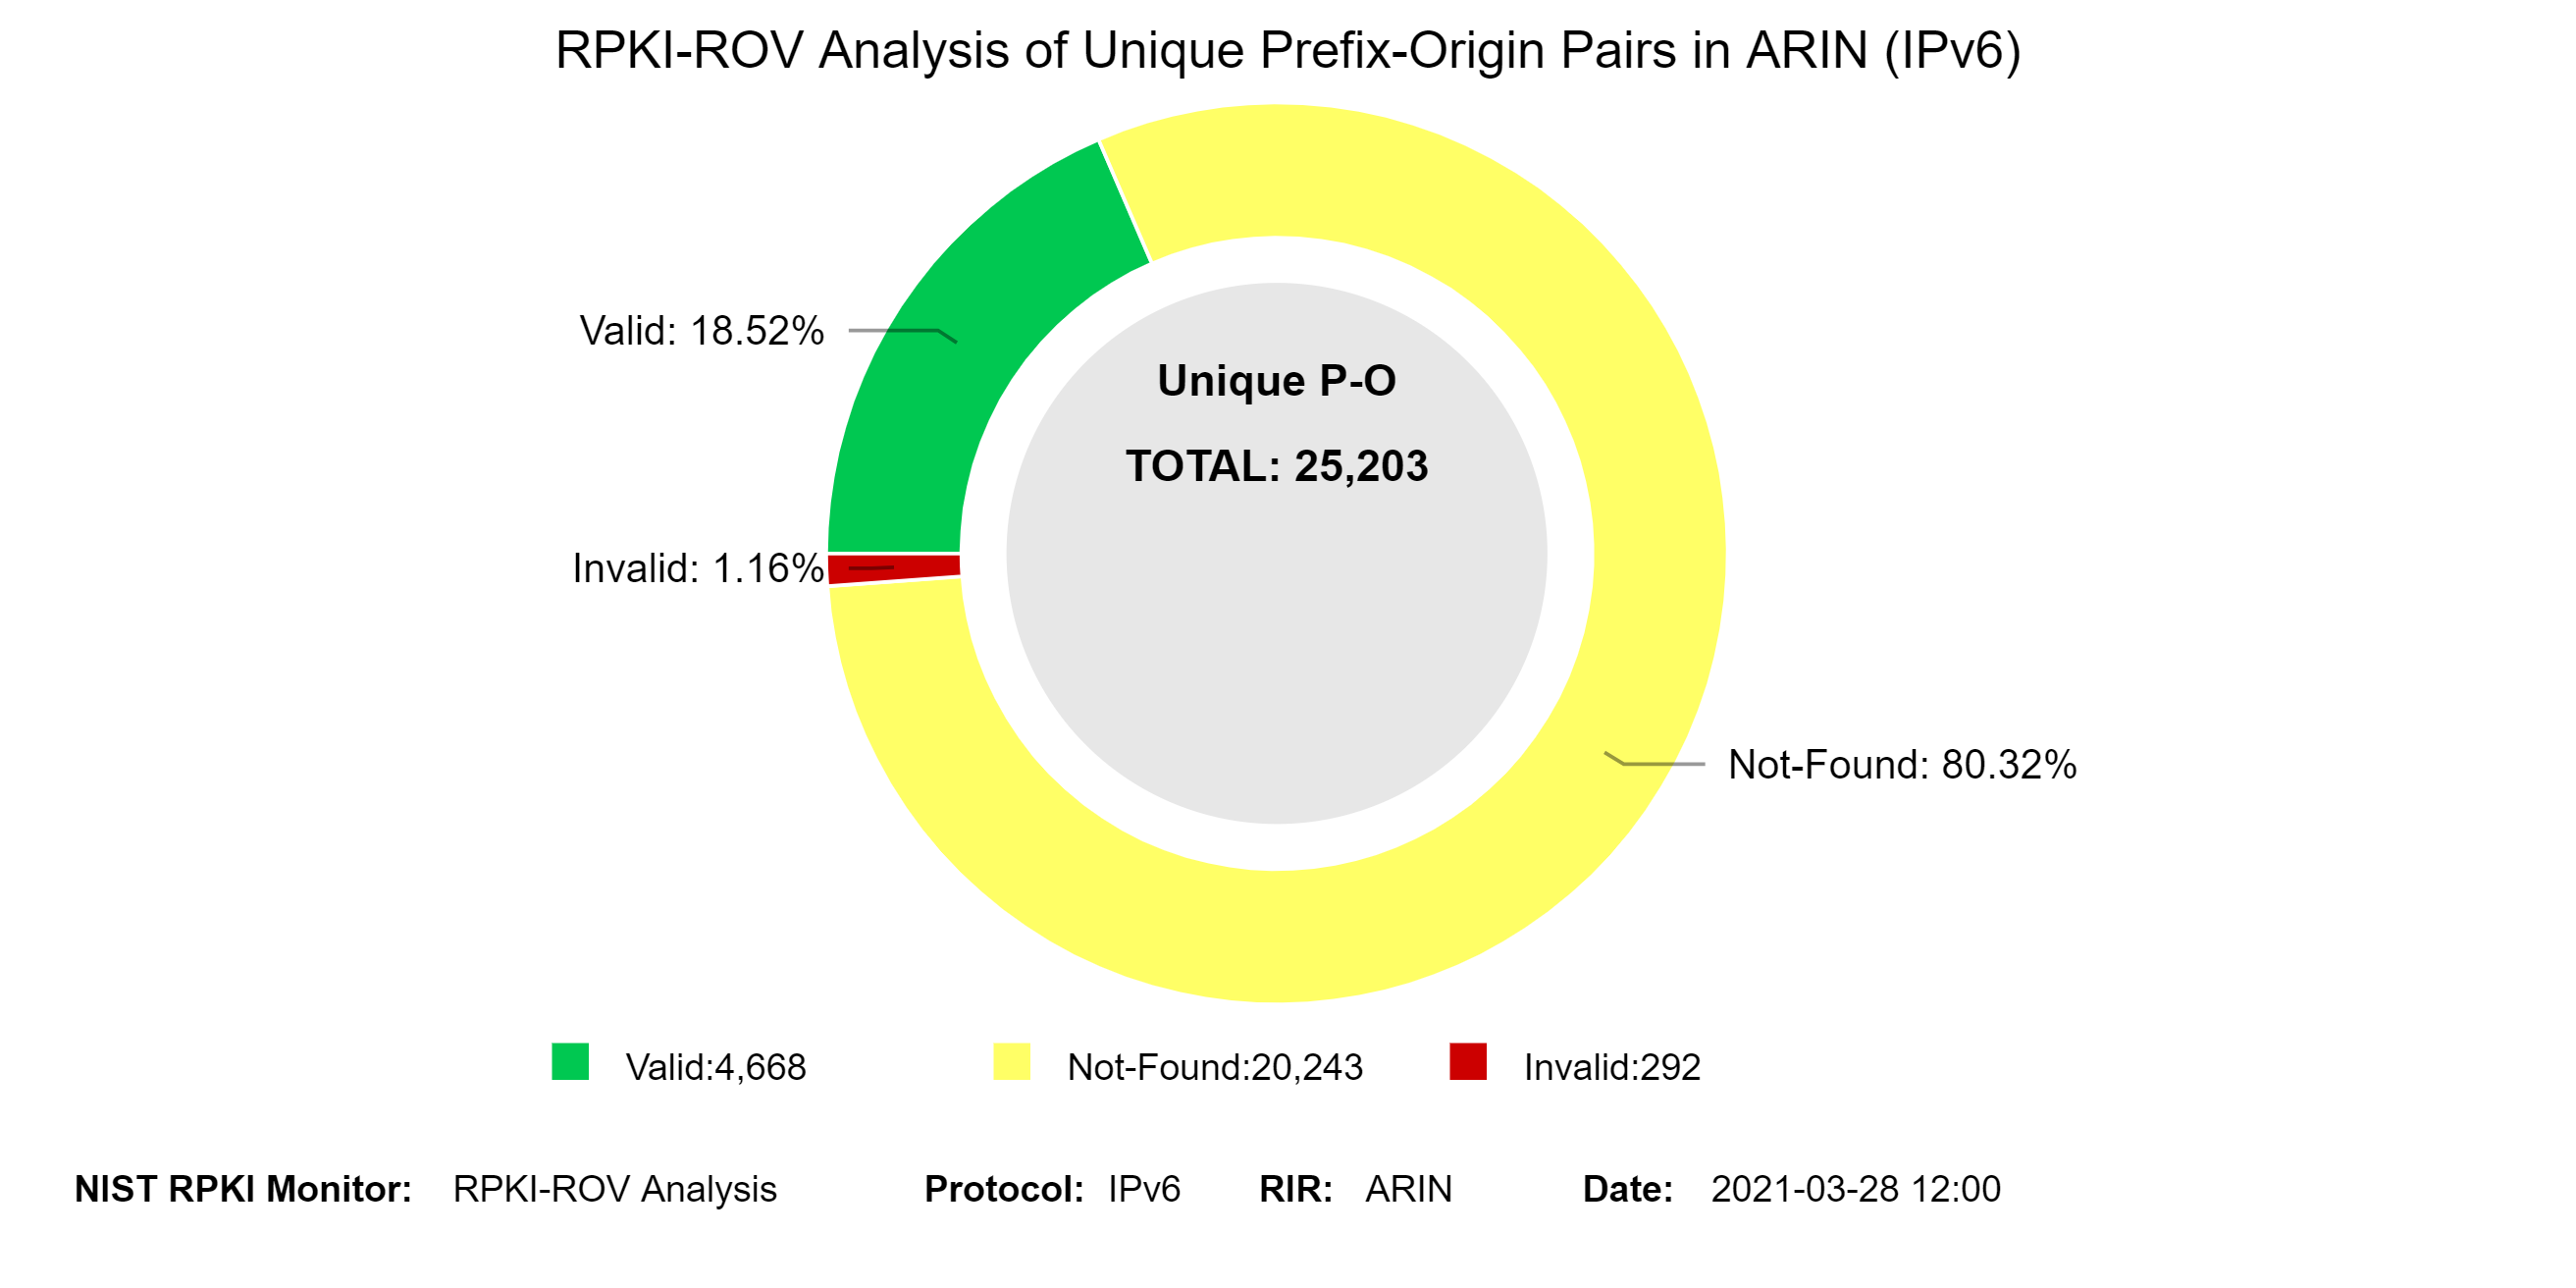
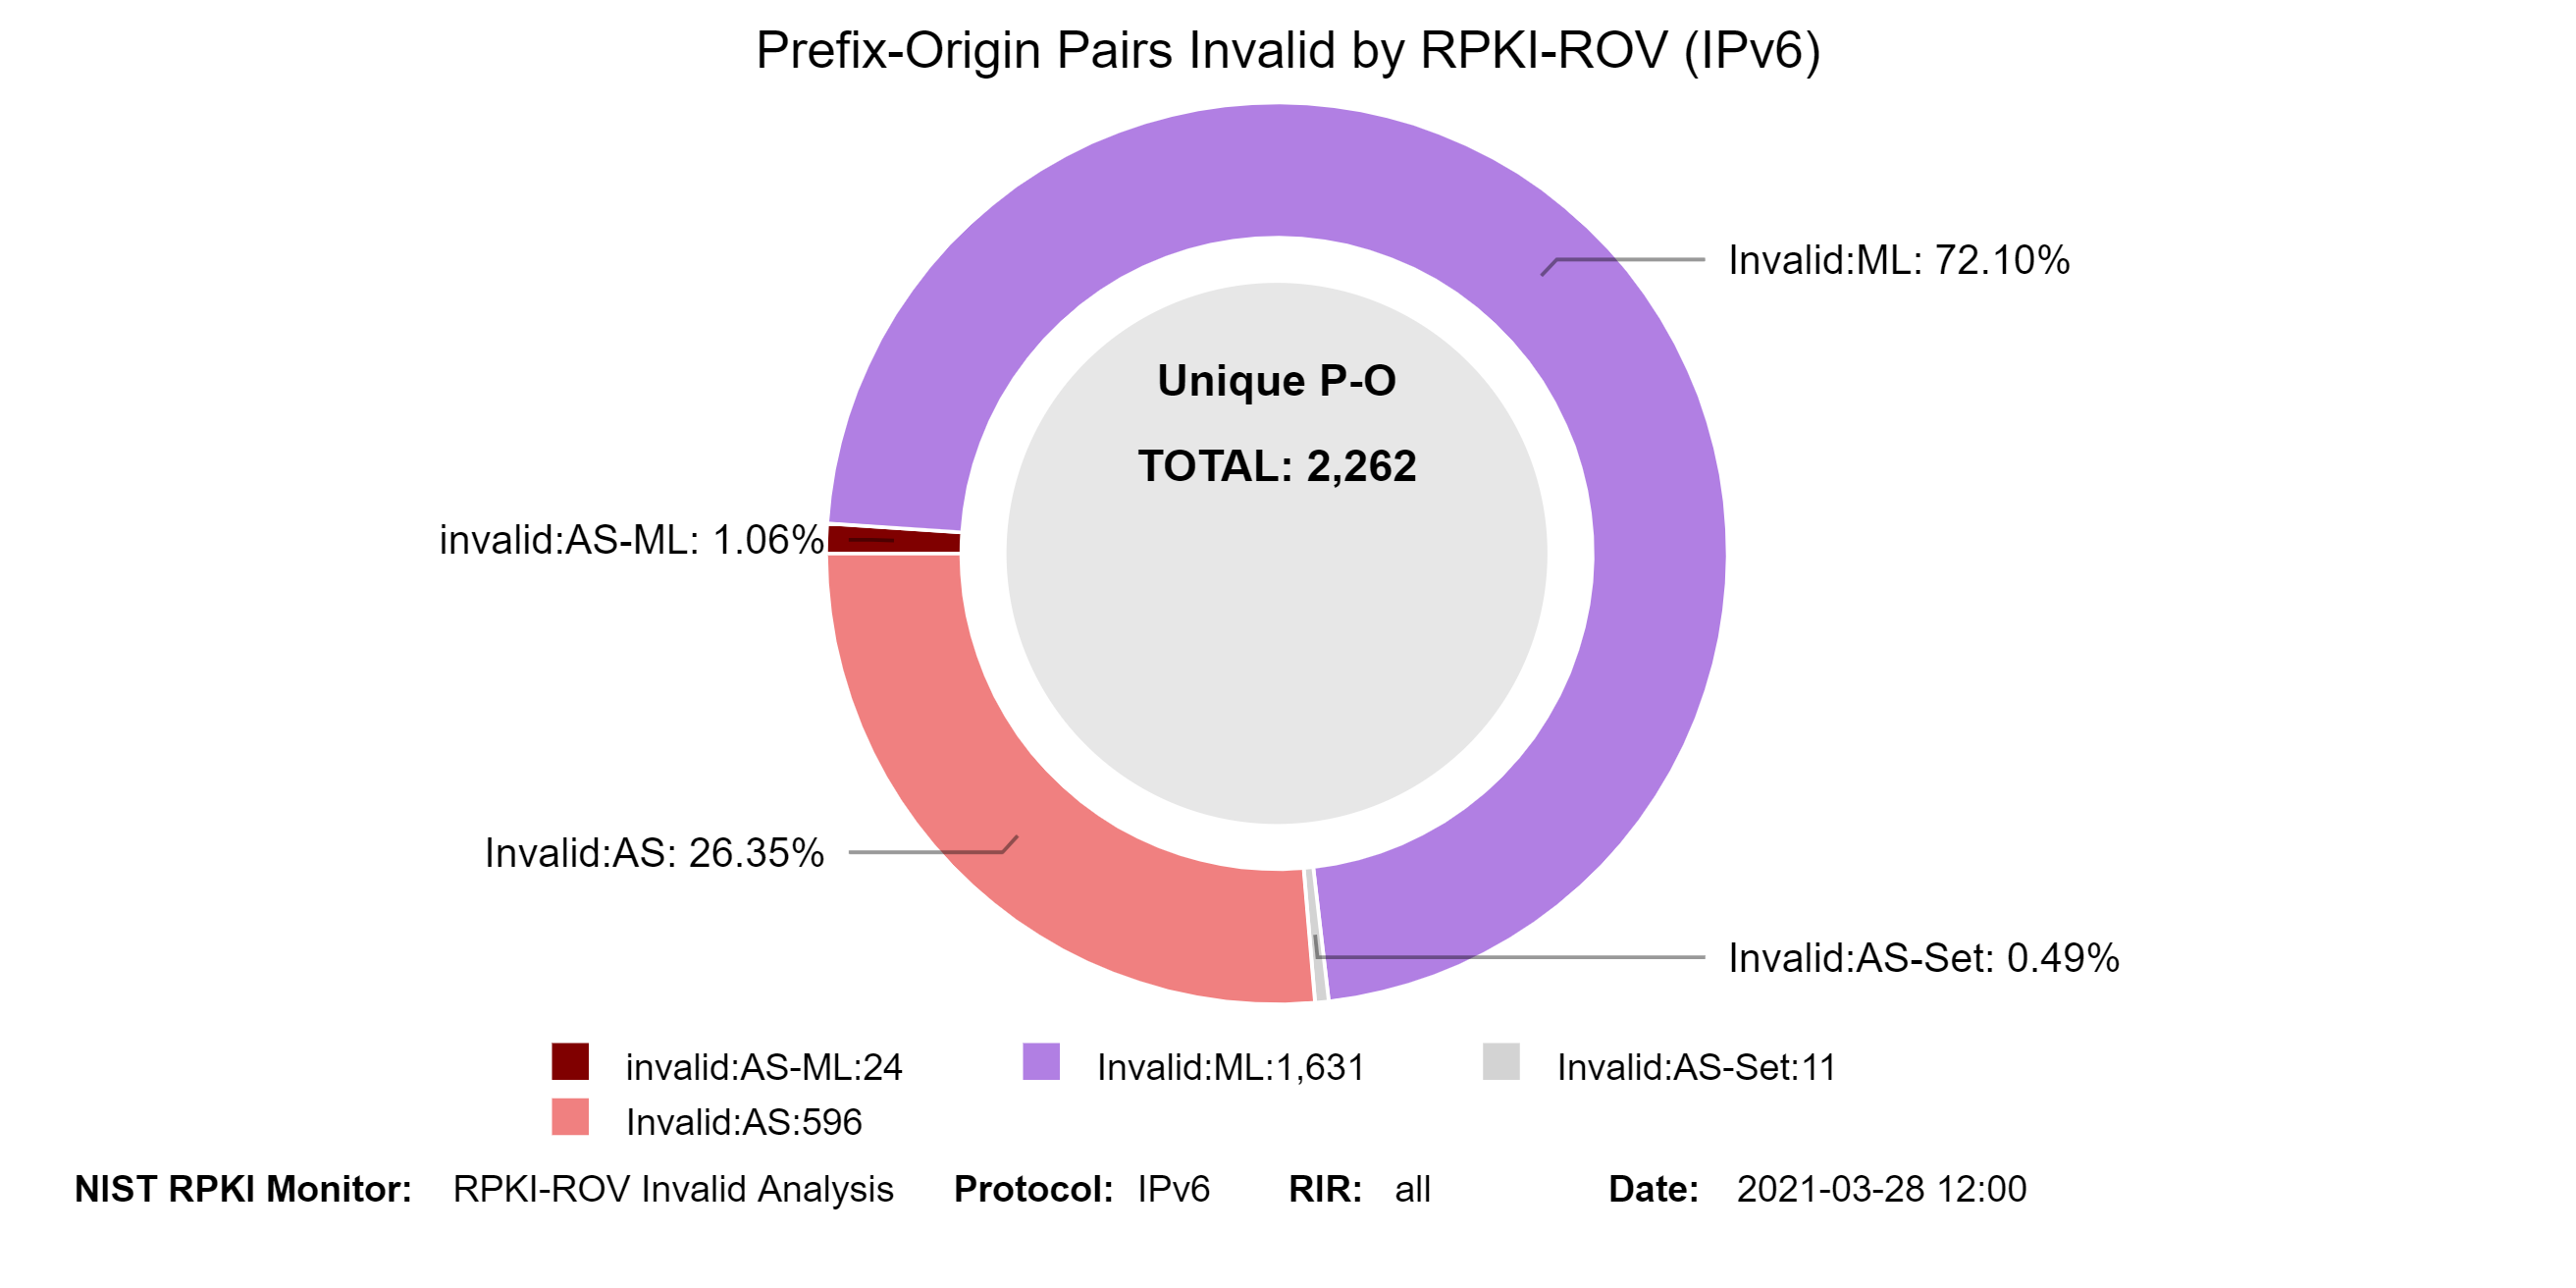
The two graphs below represent snapshots of RPKI-ROV results for both IPv4 and IPv6 unique Prefix-Origin pairs. The Prefix-Origin pairs are extracted from BGP table dumps from more than twenty RouteViews collectors (WIDE, ISC, EQUIX, JINX, KIXP, LINX, NWAX, Route-Views2.OREGON, Route-Views6.OREGON, PERTH, RouteViews3, RouteViews4, SAOPAULO, SAOPAULO2, NAPAFRICA, SFMIX, SINGAPORE, SOXRS, SYDNEY, TELXATL). The table dumps are downloaded four times per day (every six hours). All unique Prefix-Origin pairs observed in each time window are validated against the global RPKI using the algorithm described in [RFC 6811][Fig. 7, NIST SP 800-189]. Prefix-Origin validation results in one of three outcomes: Not-Found, Valid, and Invalid. The validation results Not-Found is also known as Unknown [RFC 6483]. (Note: In the Monitor tool, hover (using the mouse) over each colored slice (away from the text in the slice) to see details of what the slice depicts. This applies to all pie charts, bar charts, and in some places where there is a simple circle or oval (jump to this analysis).
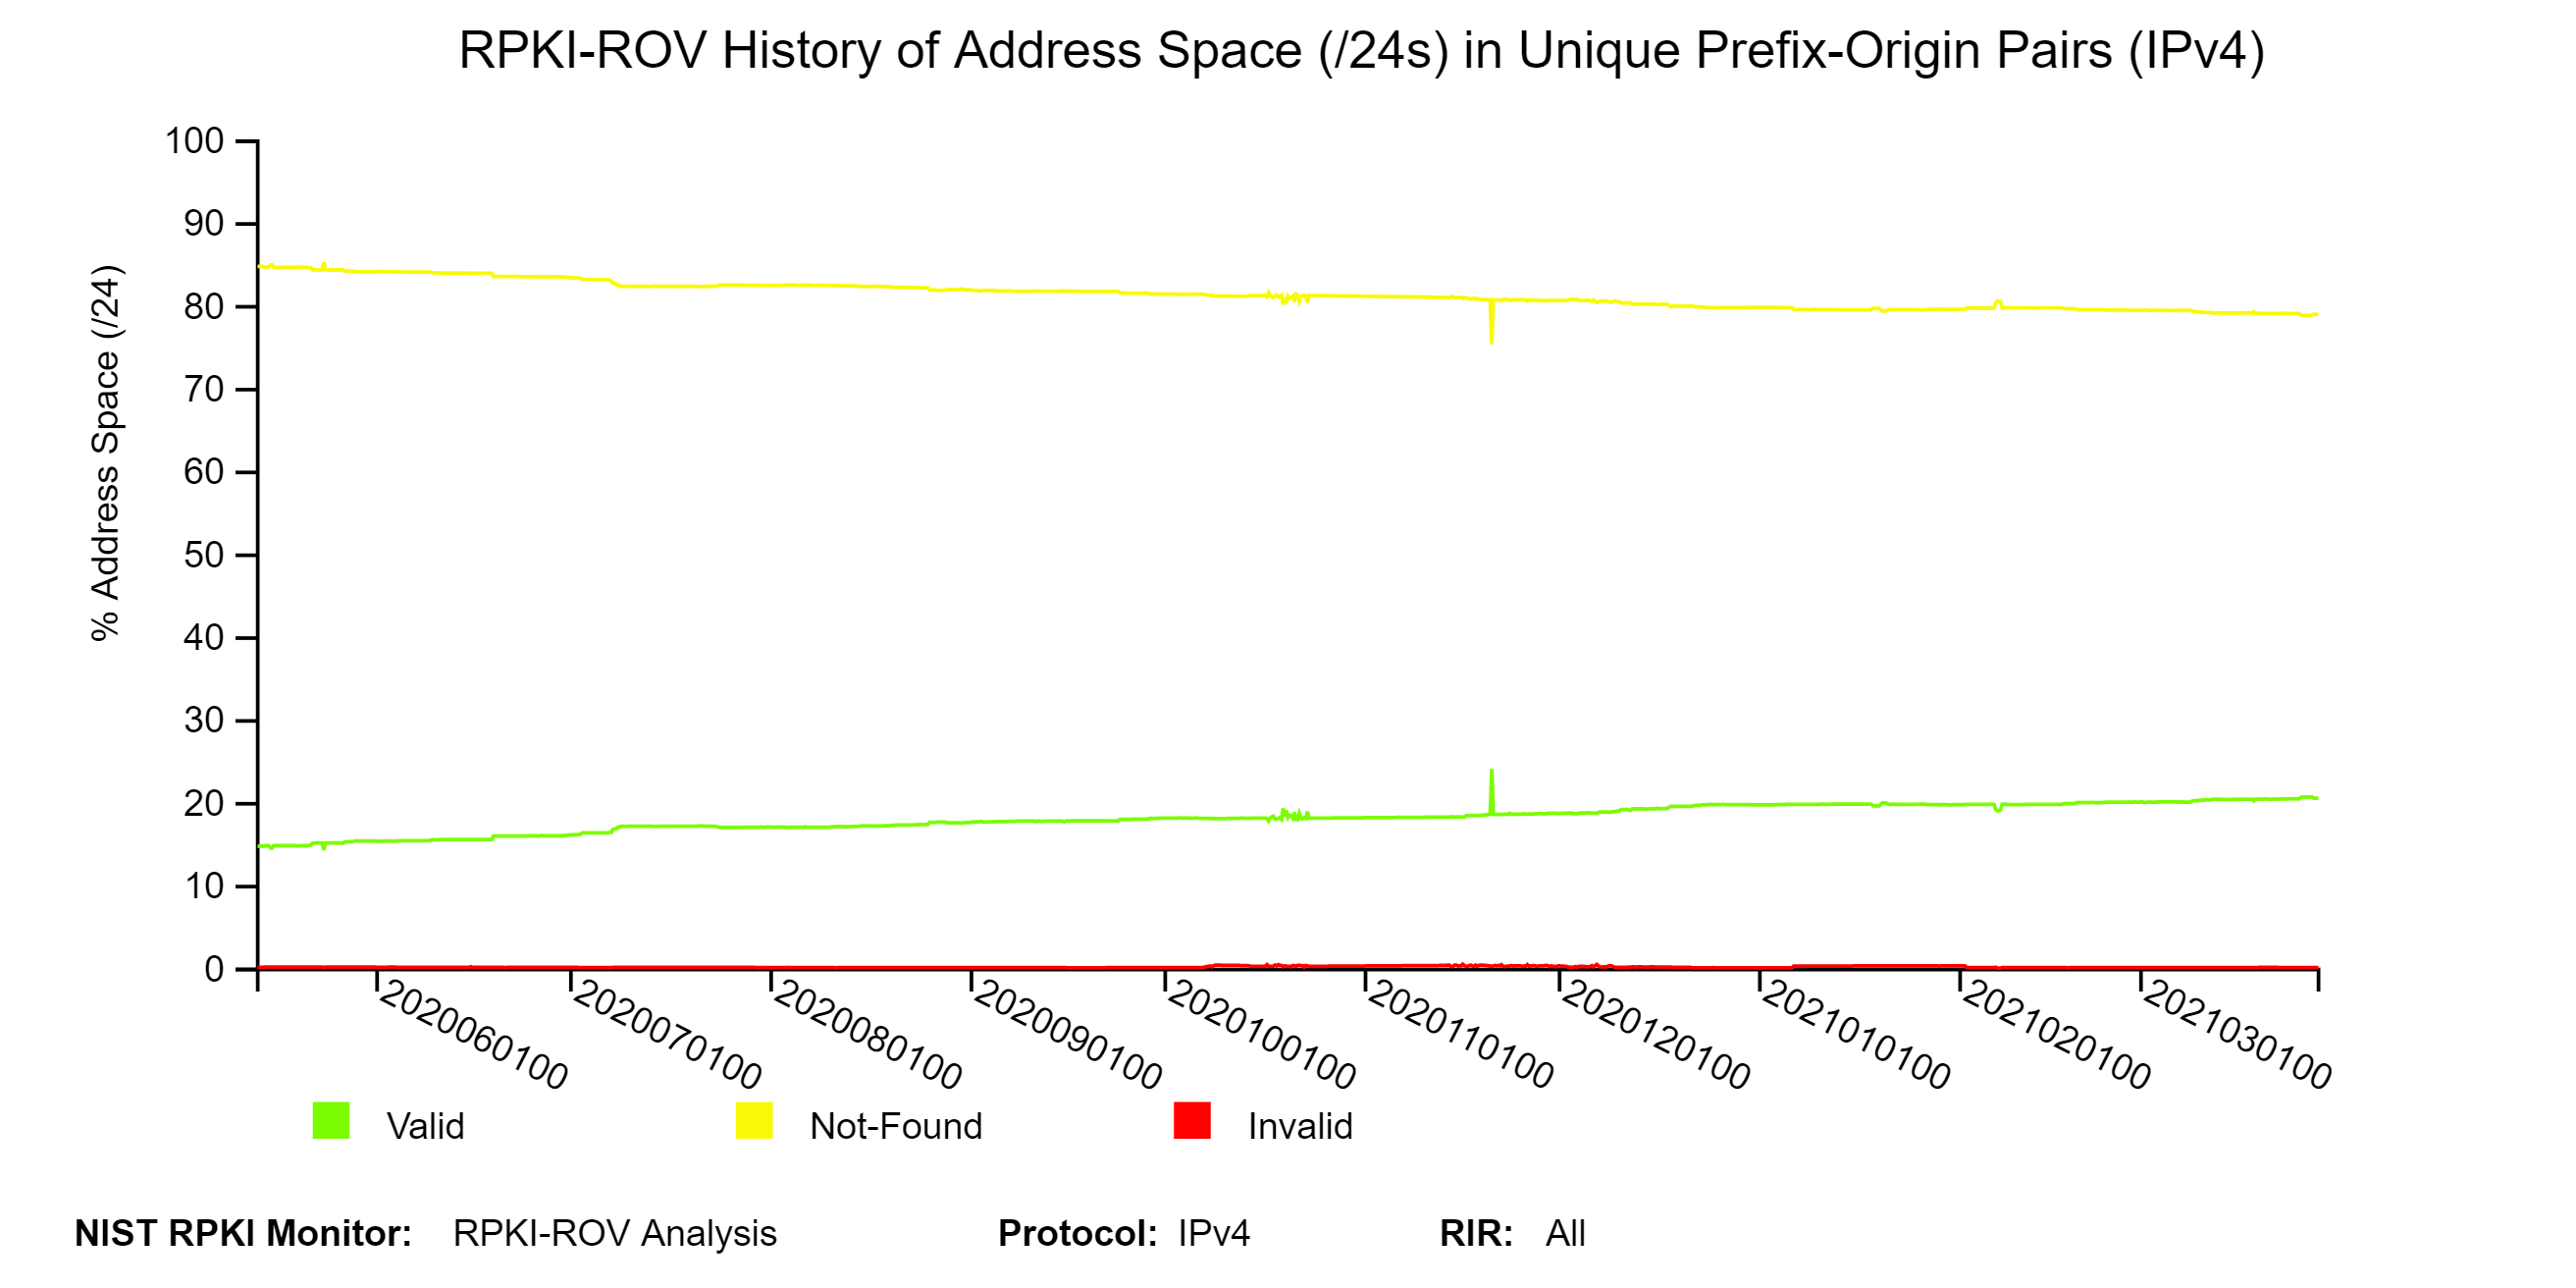
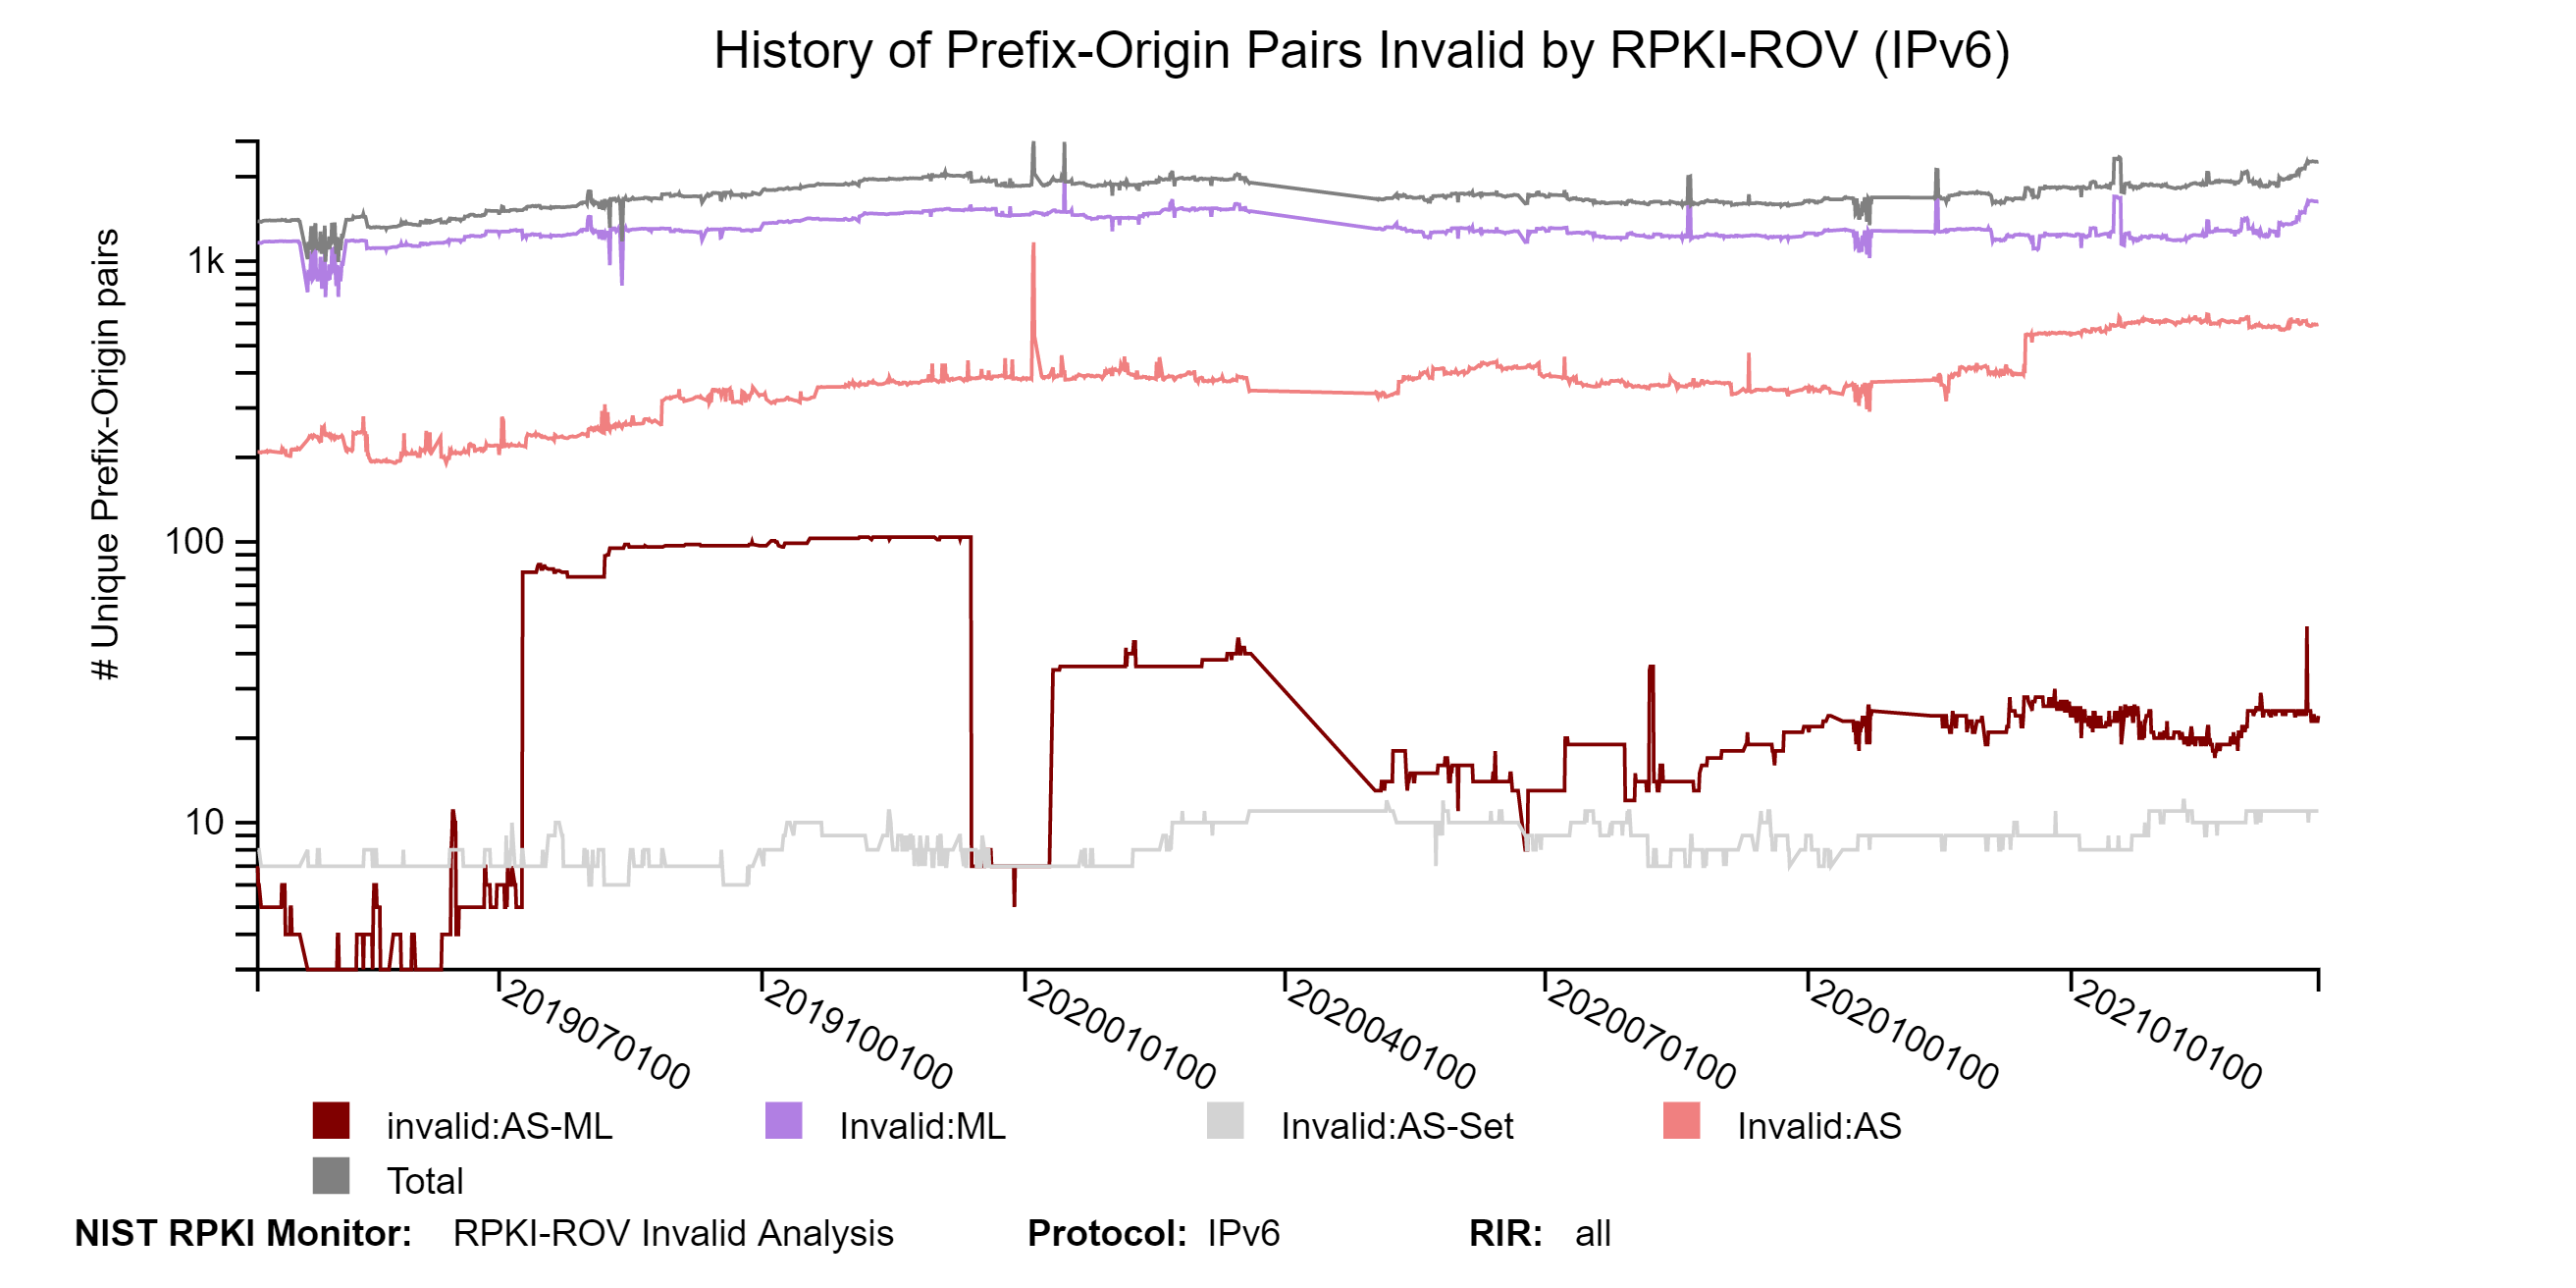
The two graphs below depict the history of RPKI-ROV results for unique IPv4 and IPv6 Prefix-Origin pairs. (Note: The data value for each position on a plot can be seen by hovering over the images with the cursor. This is true for all temporal plots in the Monitor.) The graph offers the ability to view it in a log or linear scale by clicking on the LOG SCALE / LINEAR SCALE tab. The COMPARE RIR tab facilitates comparison across RIRs. When the LOG SCALE is selected, the raw counts are plotted on a logarithmic y-axis. When the LINEAR SCALE is selected, the percentages (as a percent of the global unique Prefix-Origin pairs) are plotted (jump to this analysis).
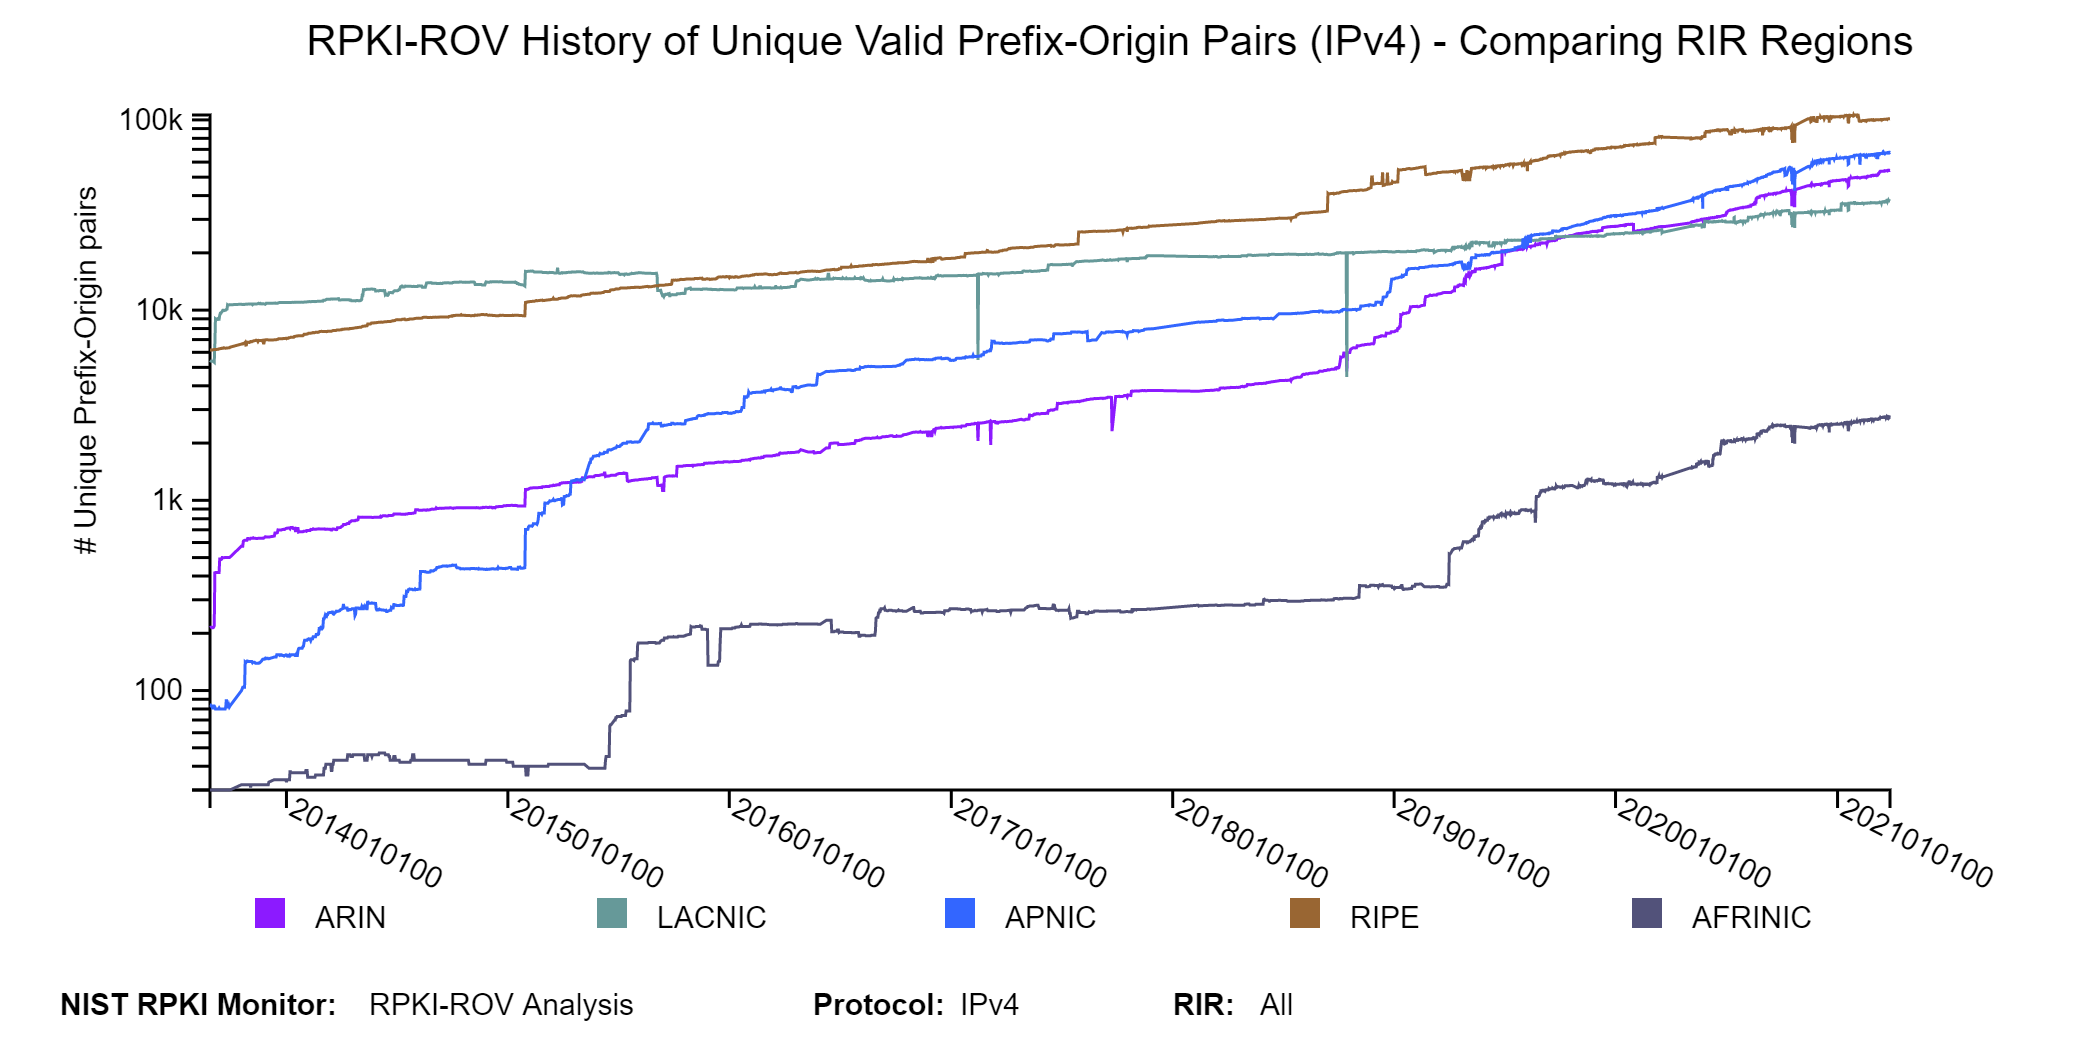
In the above-described history graph (for IPv4), when the COMPARE RIR tab is clicked, then graphs comparing RIRs are displayed for Valid, Invalid, and NotFound unique Prefix-Origin pairs. One of these graphs for the Valid case is shown below. This graph depicts a comparison across RIRs of the history of RPKI-ROV analysis results for unique Valid Prefix-Origin pairs plotted at six-hour intervals. When LOG SCALE (default) is selected, the raw counts for each RIR are plotted on a logarithmic y-axis. When the LINEAR SCALE is selected, the corresponding percentages – as a percent of the total # unique announced Prefix-Origin pairs with prefixes in the corresponding RIR – are plotted (jump to this analysis).
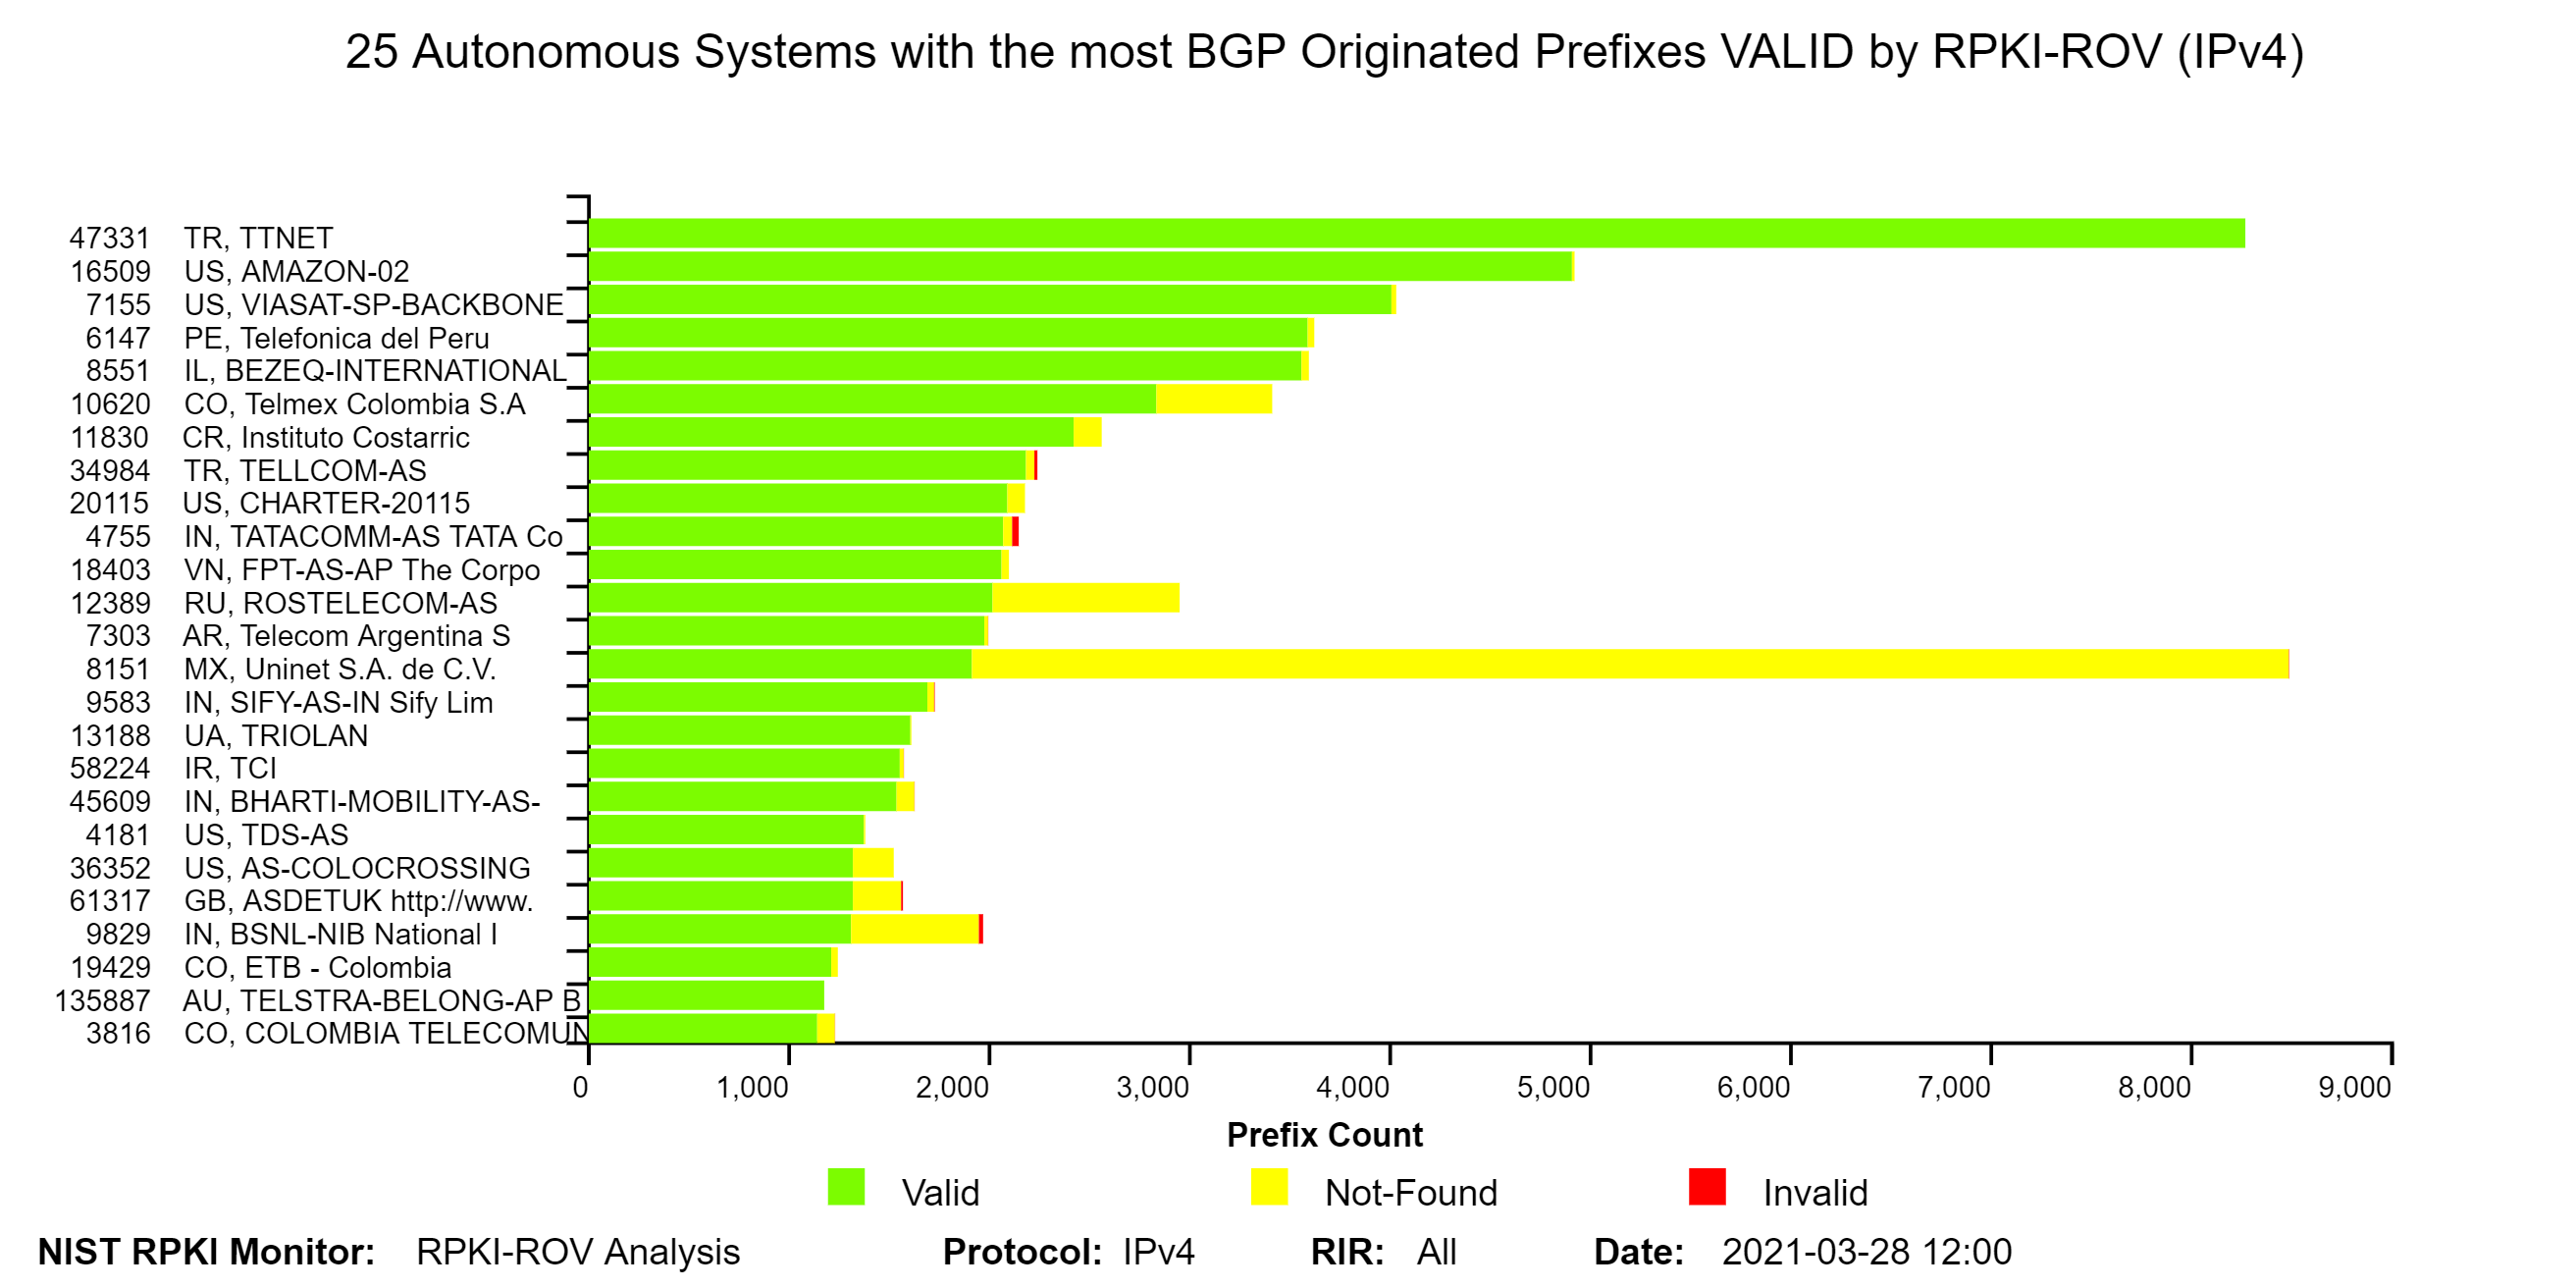
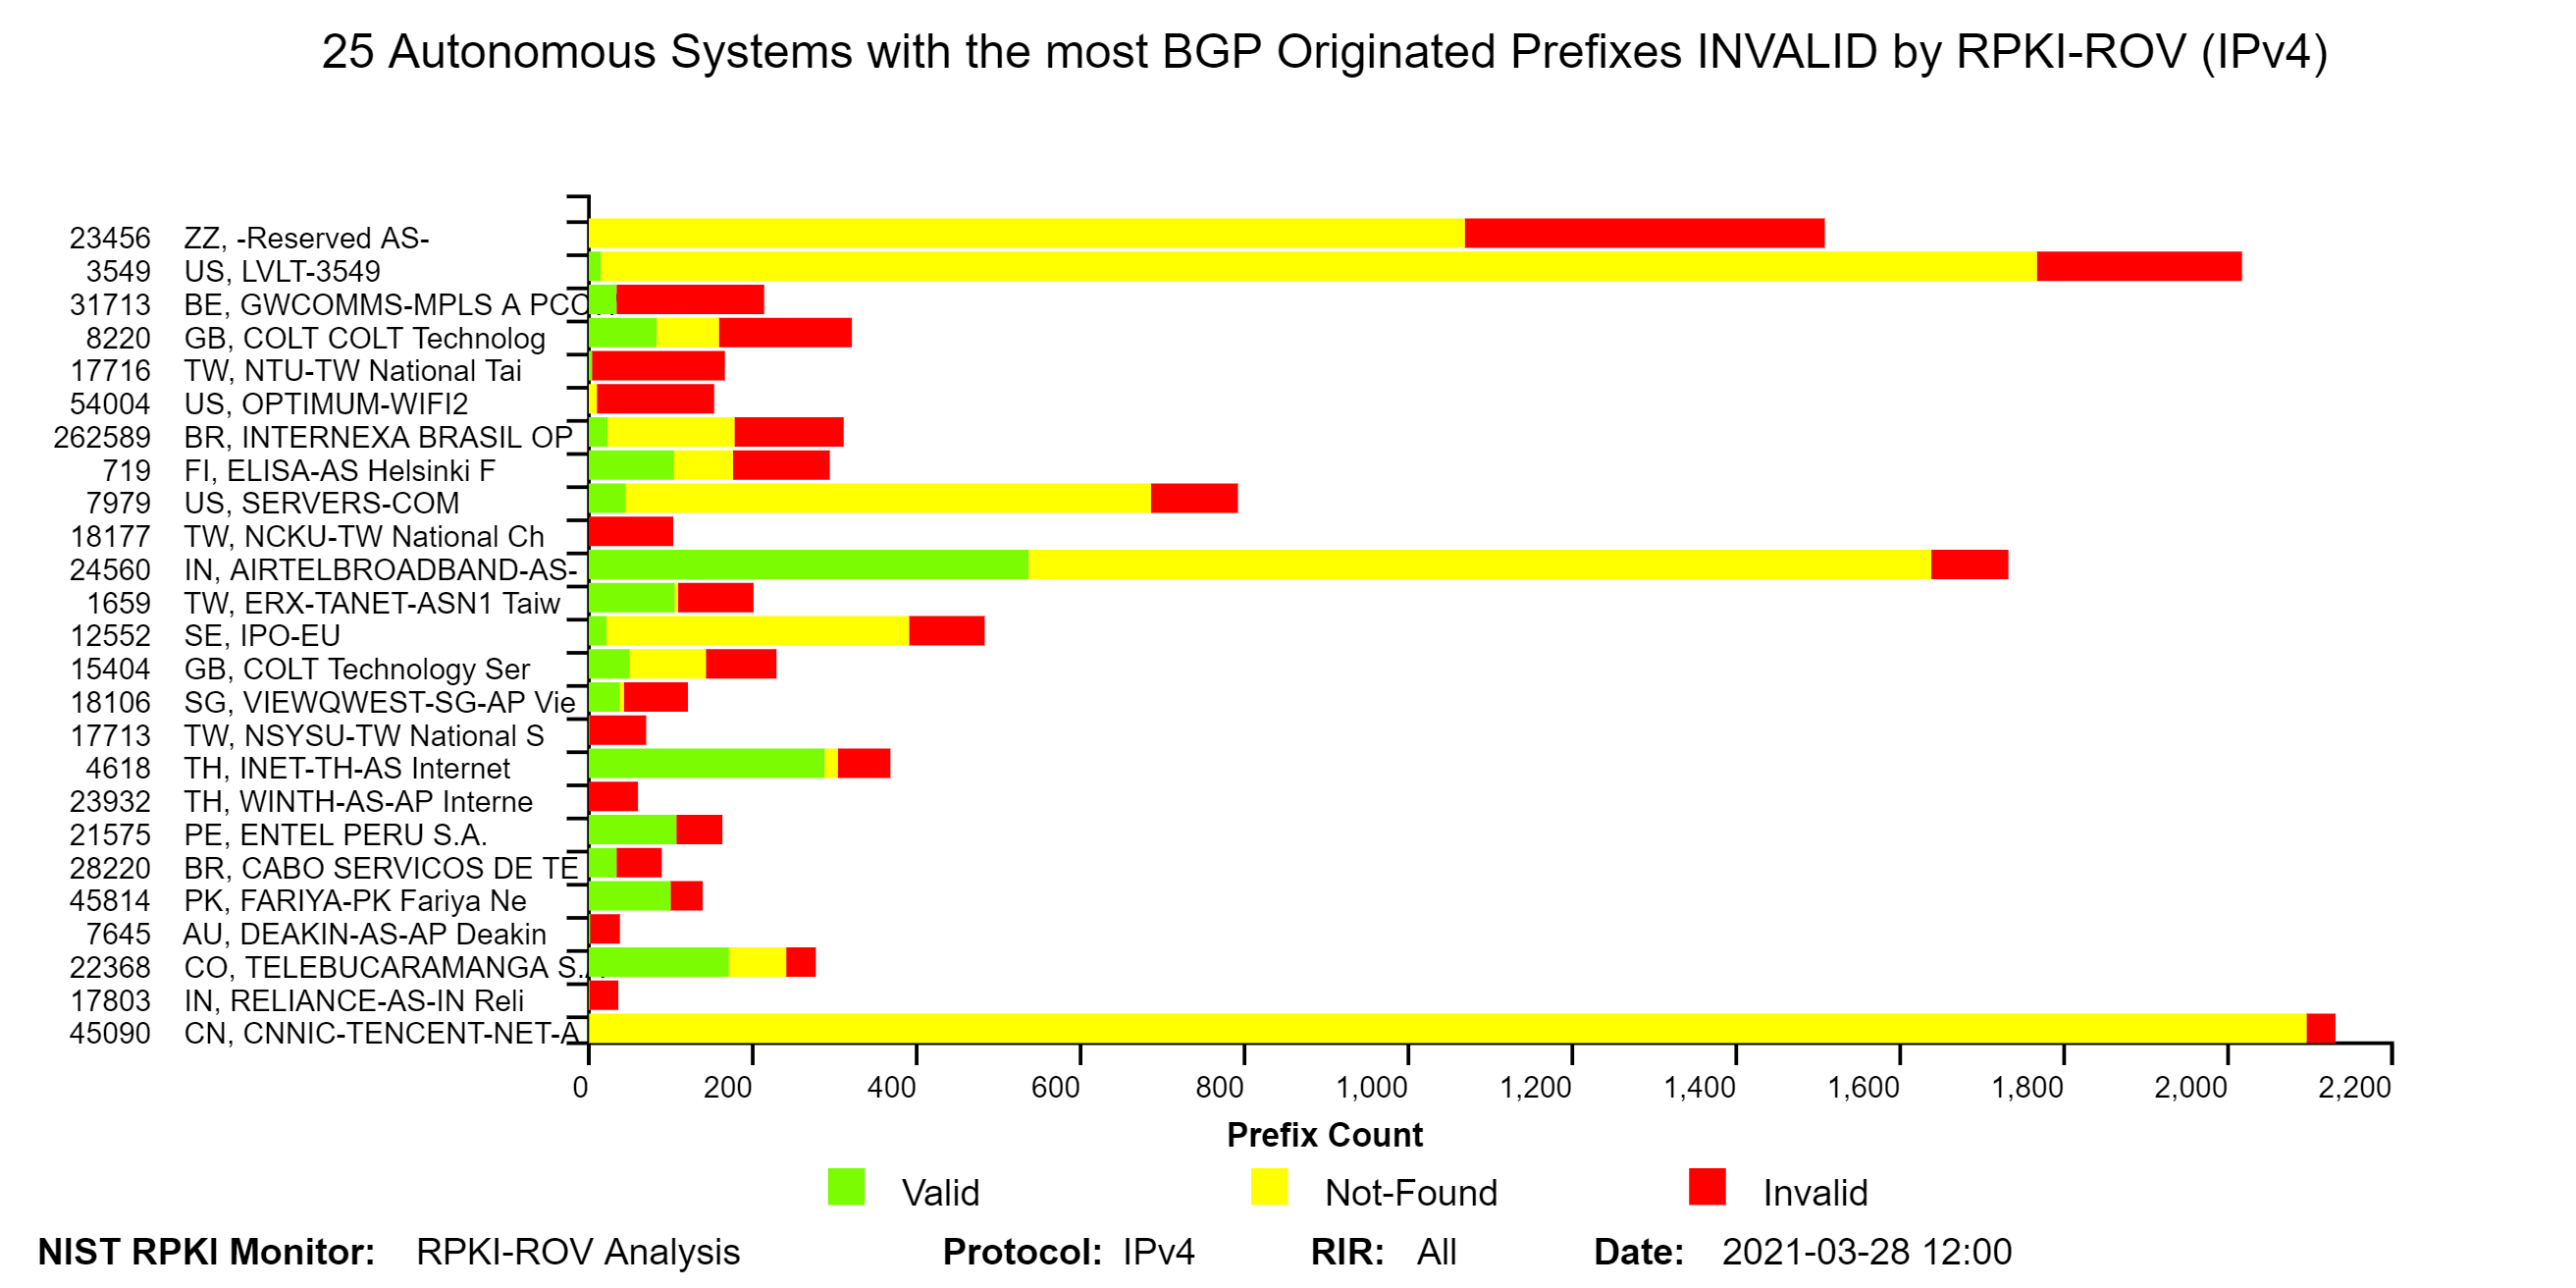
The two graphs below depict the top 25 Autonomous Systems (ASes) with the most BGP observed IPv4 prefixes Valid by RPKI-ROV and the top 25 ASes with the most BGP observed IPv4 prefixes Invalid by RPKI-ROV. In these bar graphs in the Monitor, hover over any bar and a text box pops up with validation details for the corresponding AS. Similar graphs are also available for IPv6 in the Monitor (jump to this analysis).
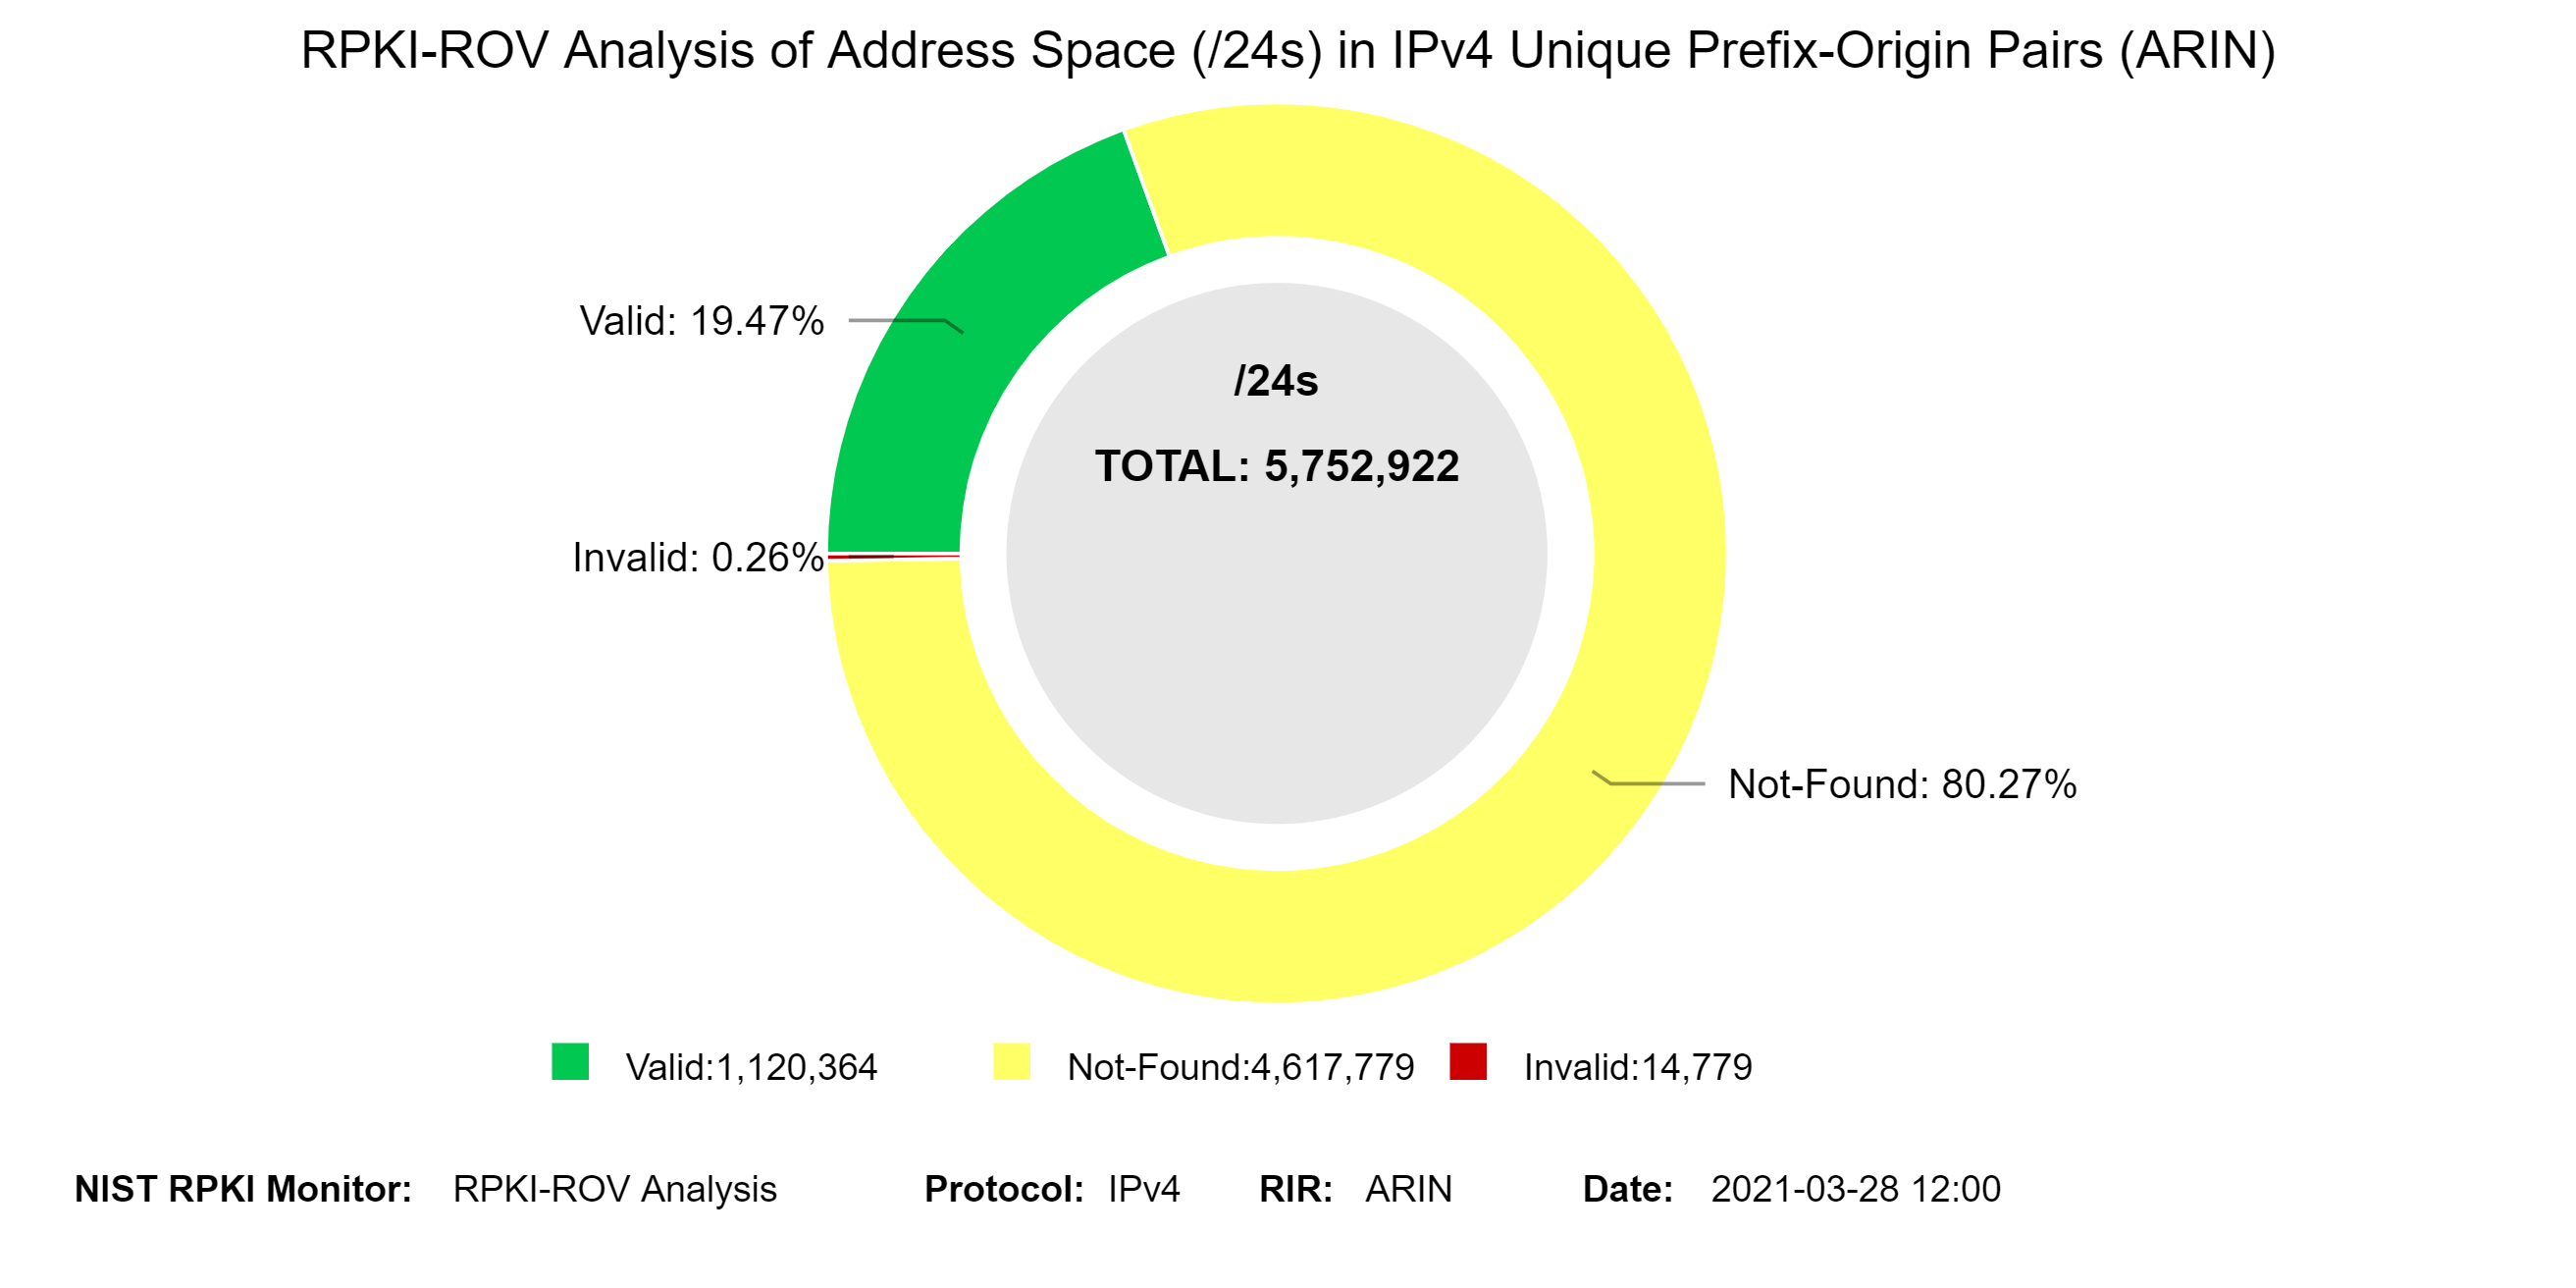
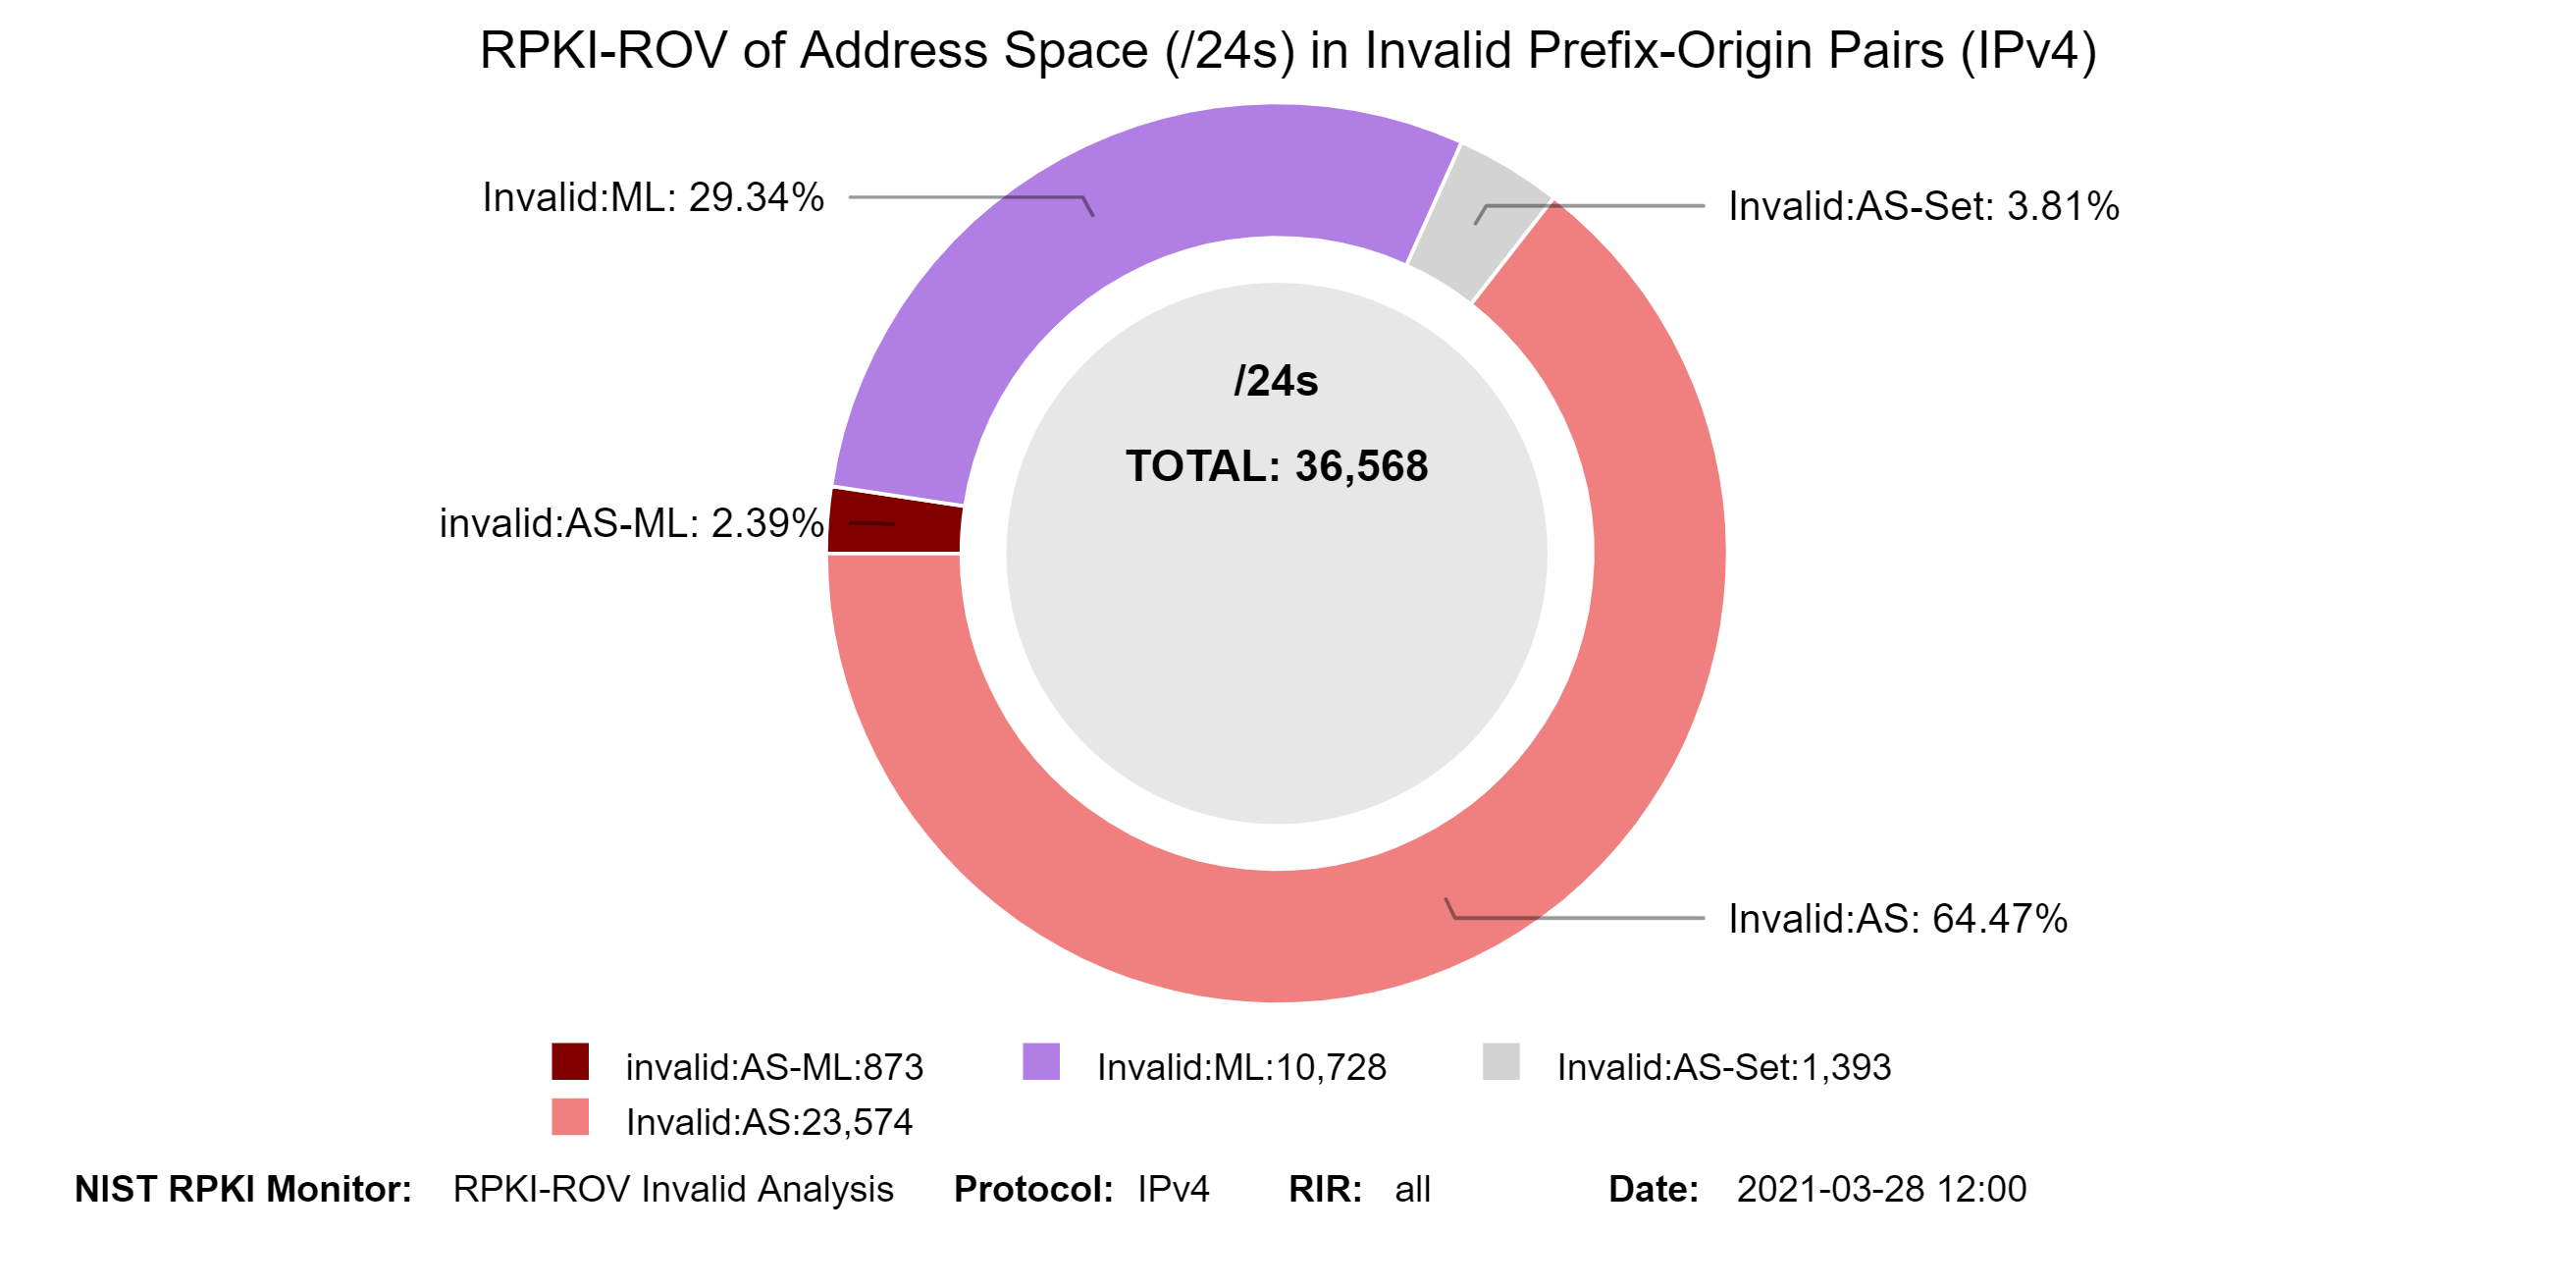
 The graph below represents a snapshot of RPKI-ROV results for IPv4 address space (in terms of /24s) contained in unique Prefix-Origin pairs (jump to this analysis).
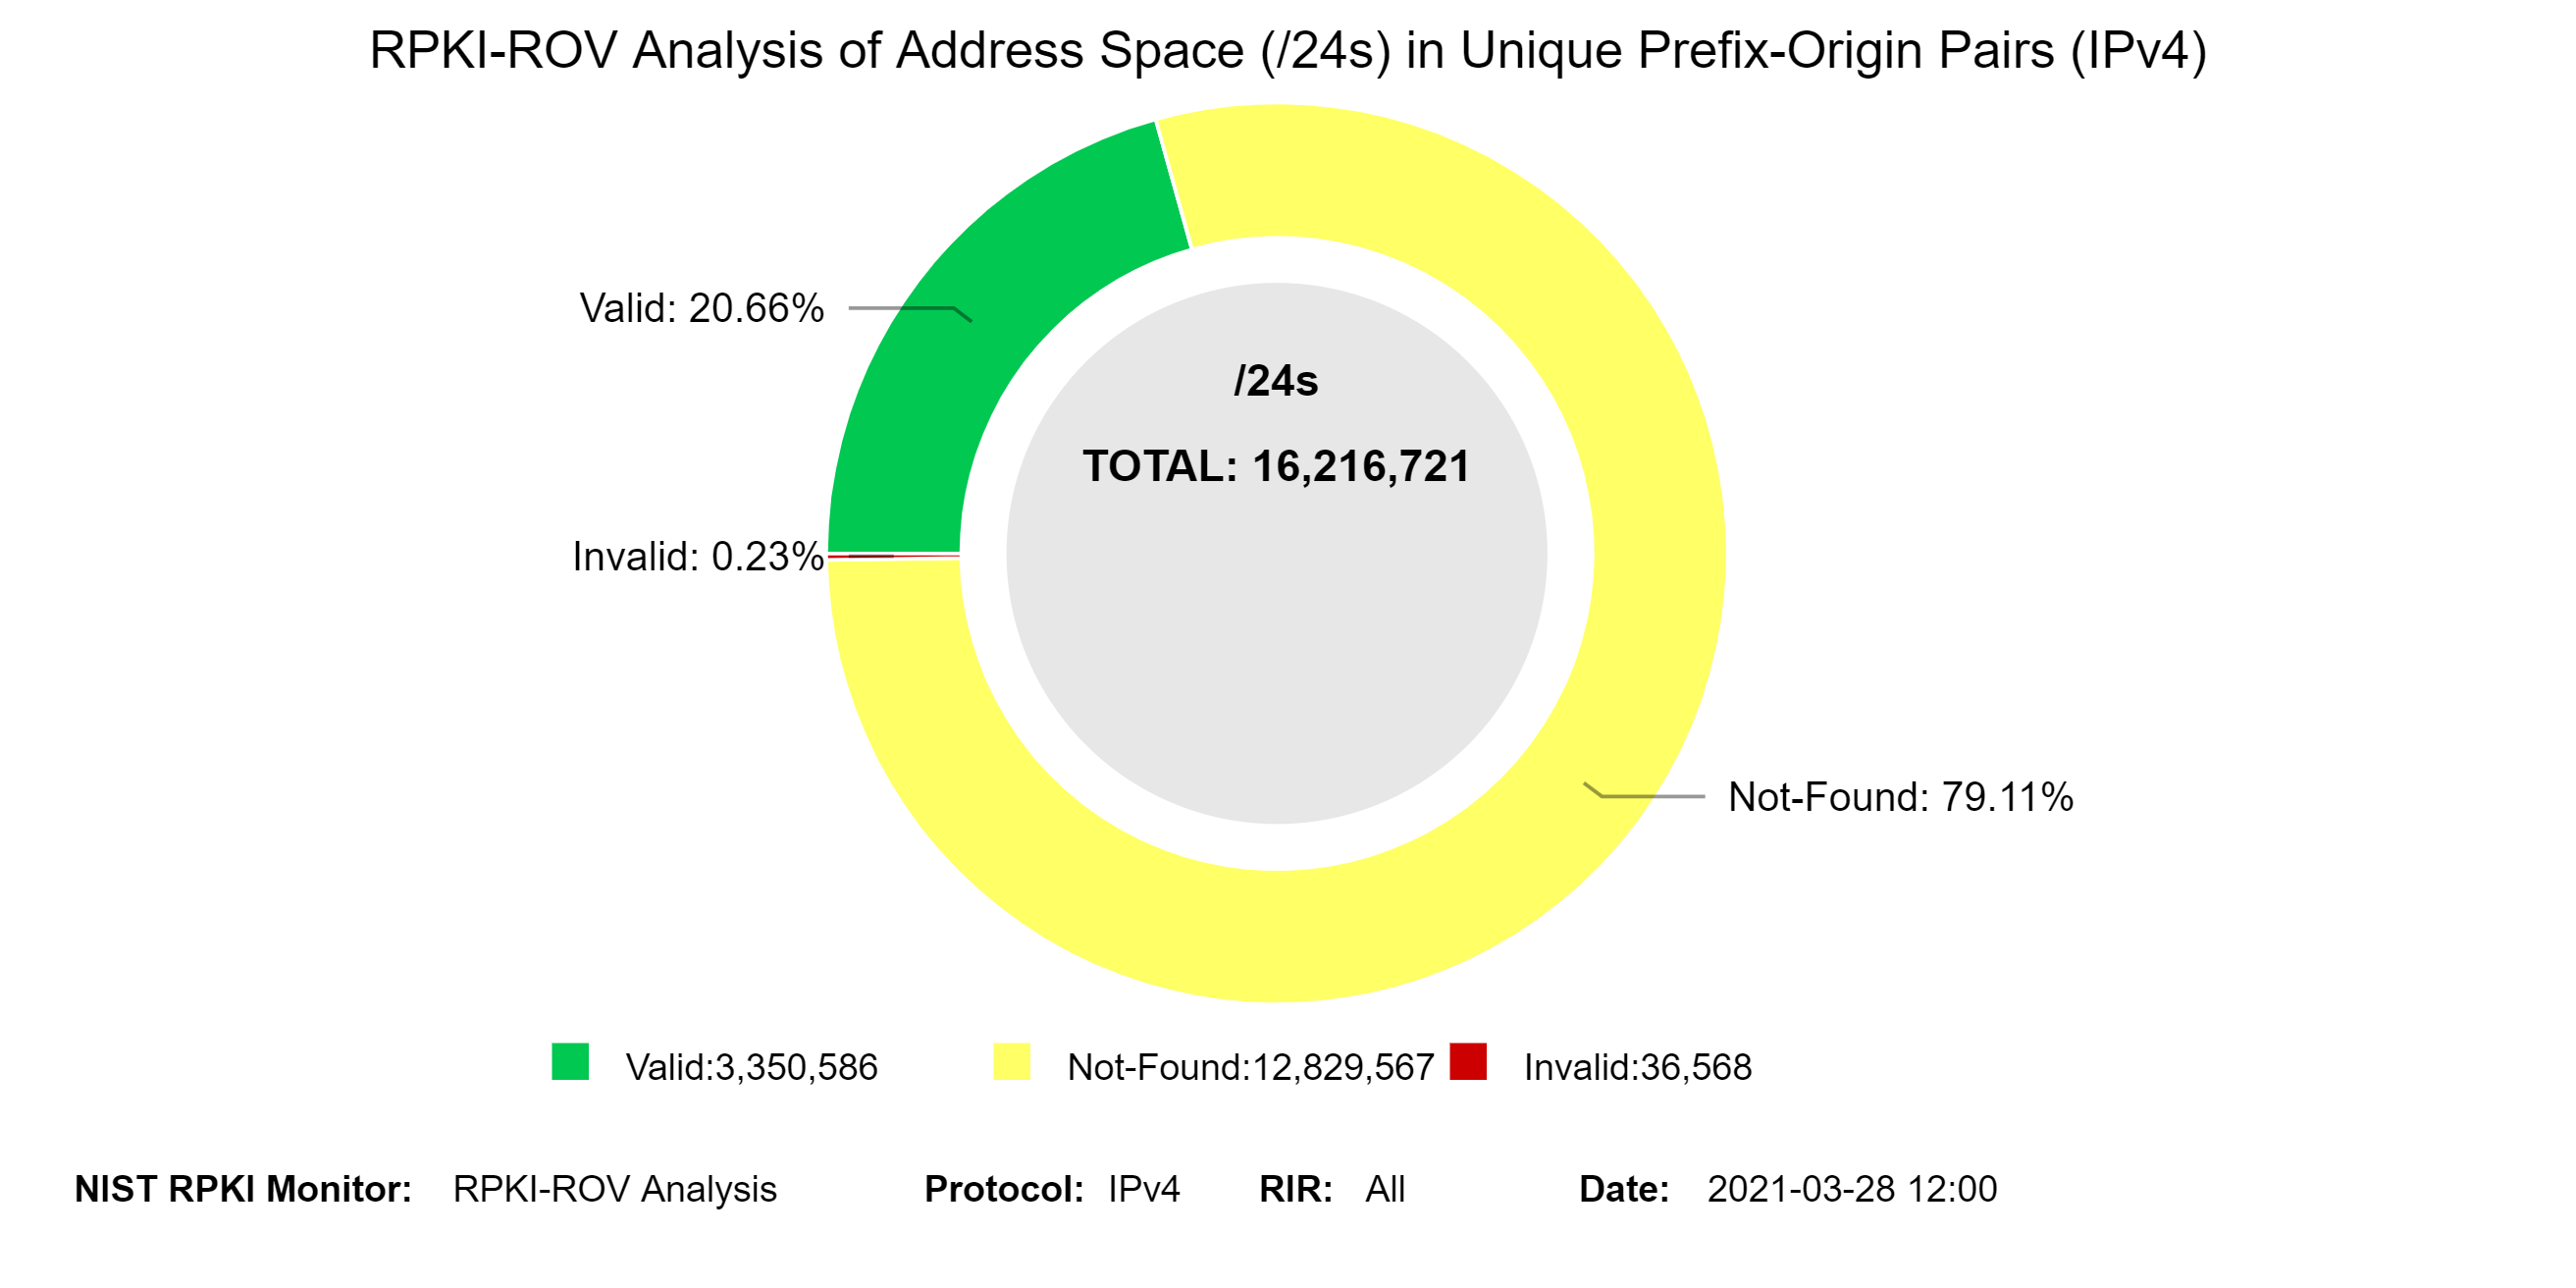
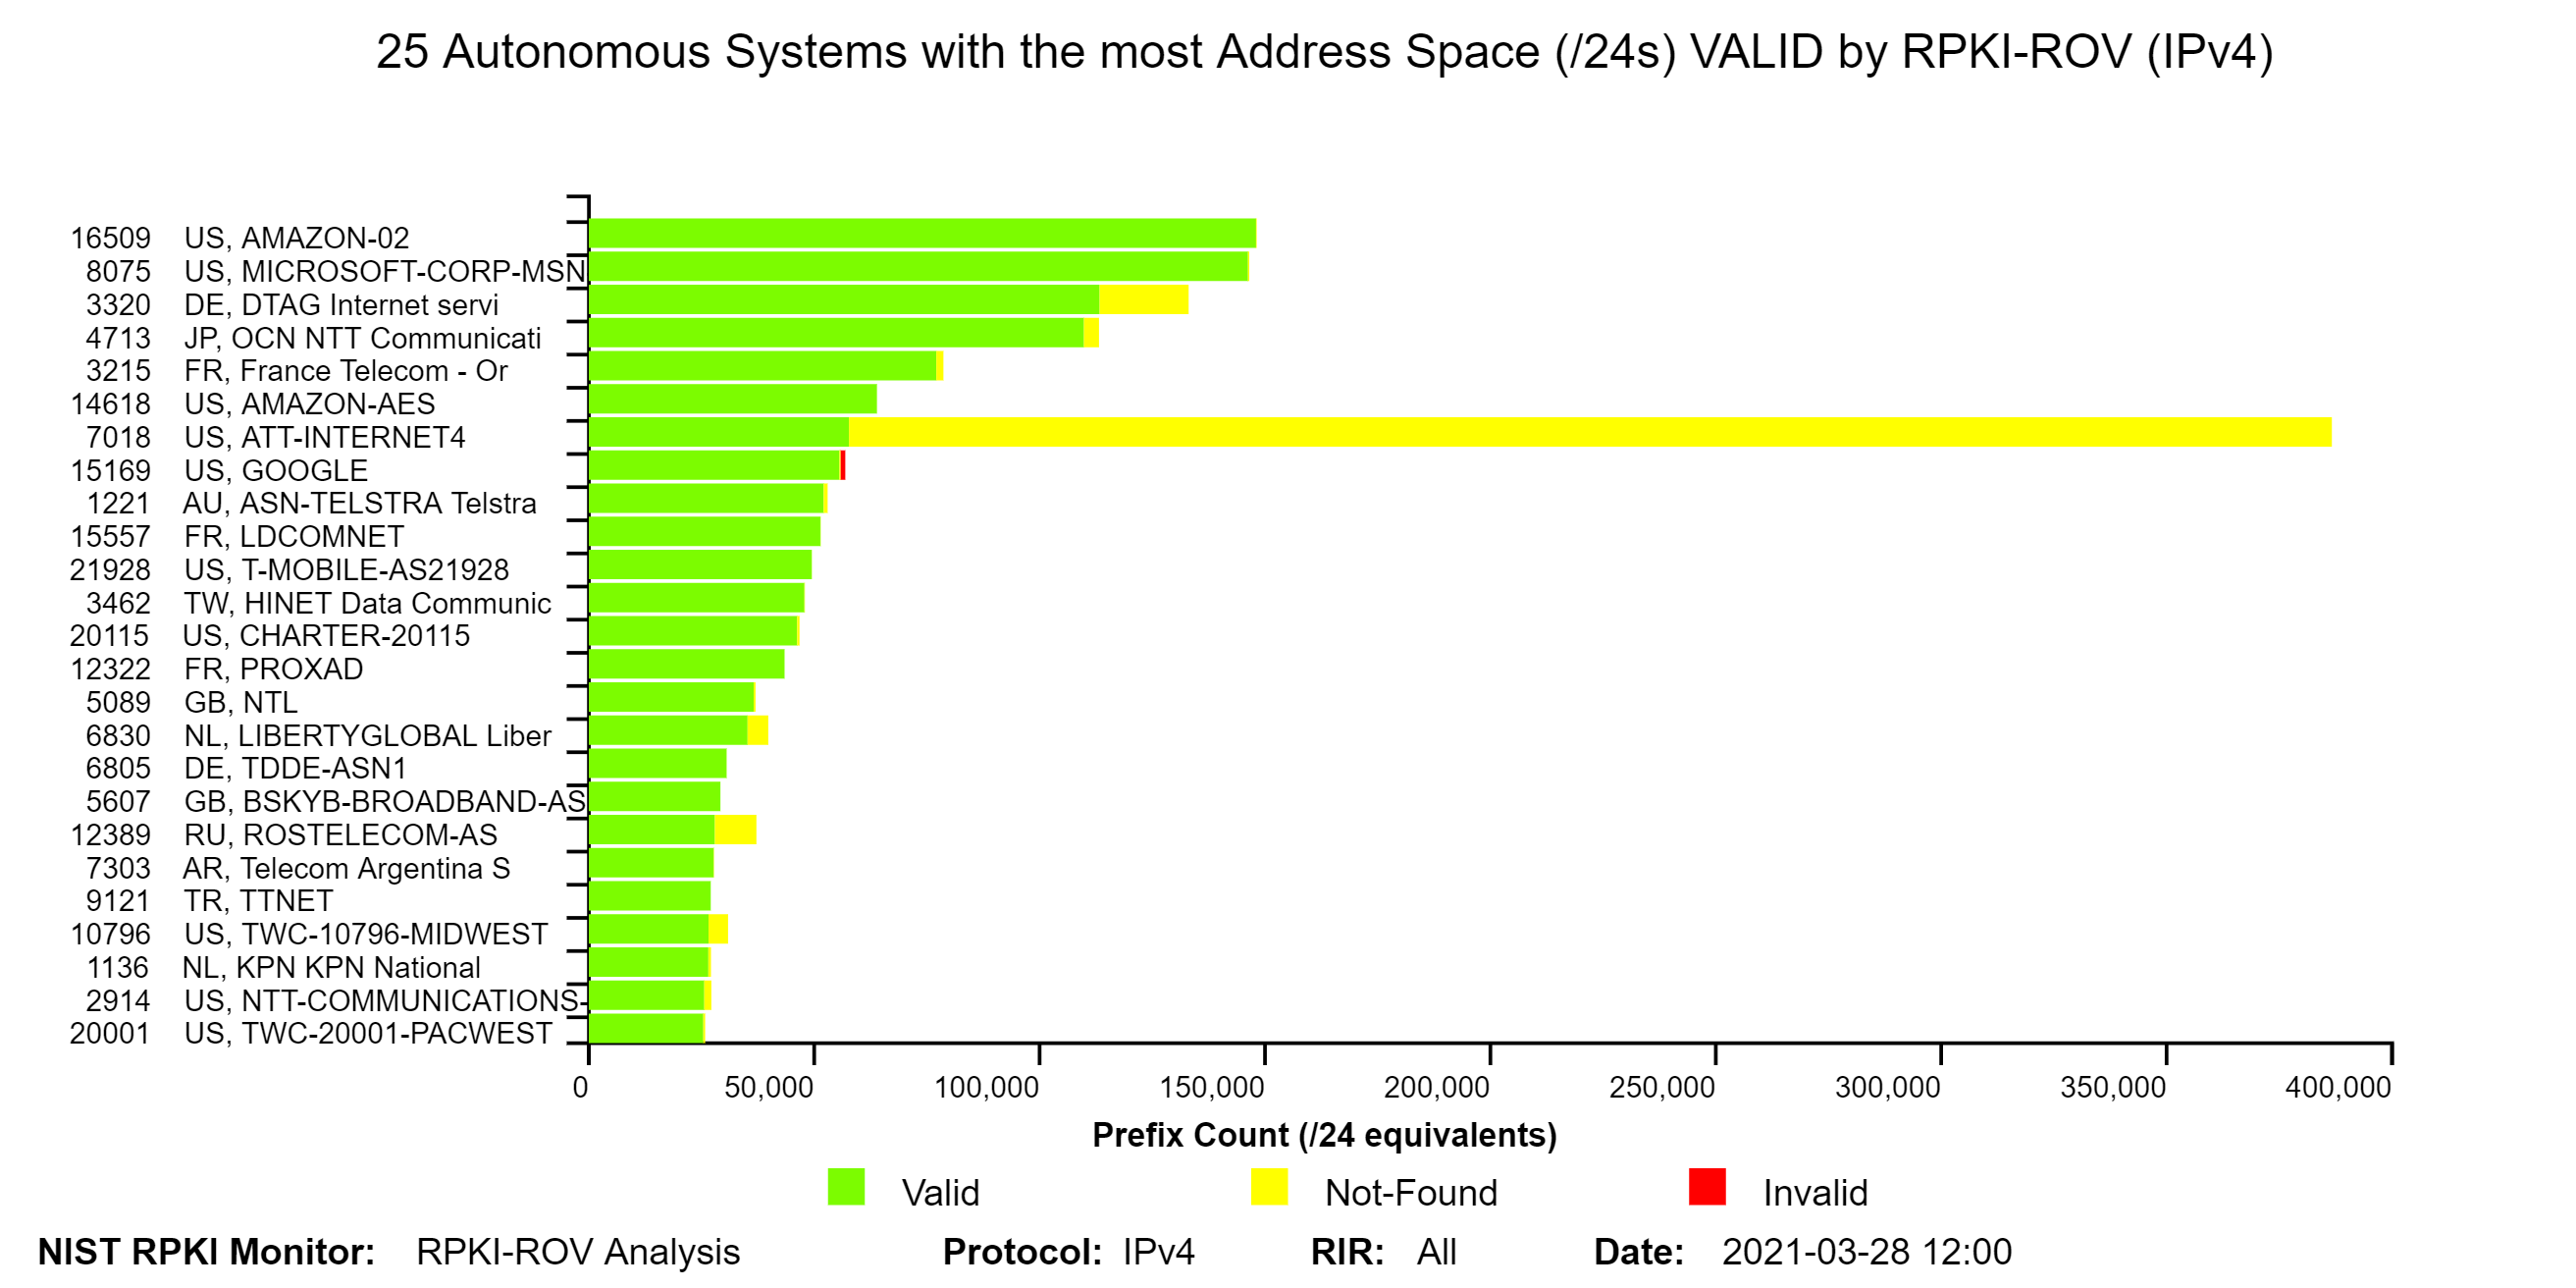
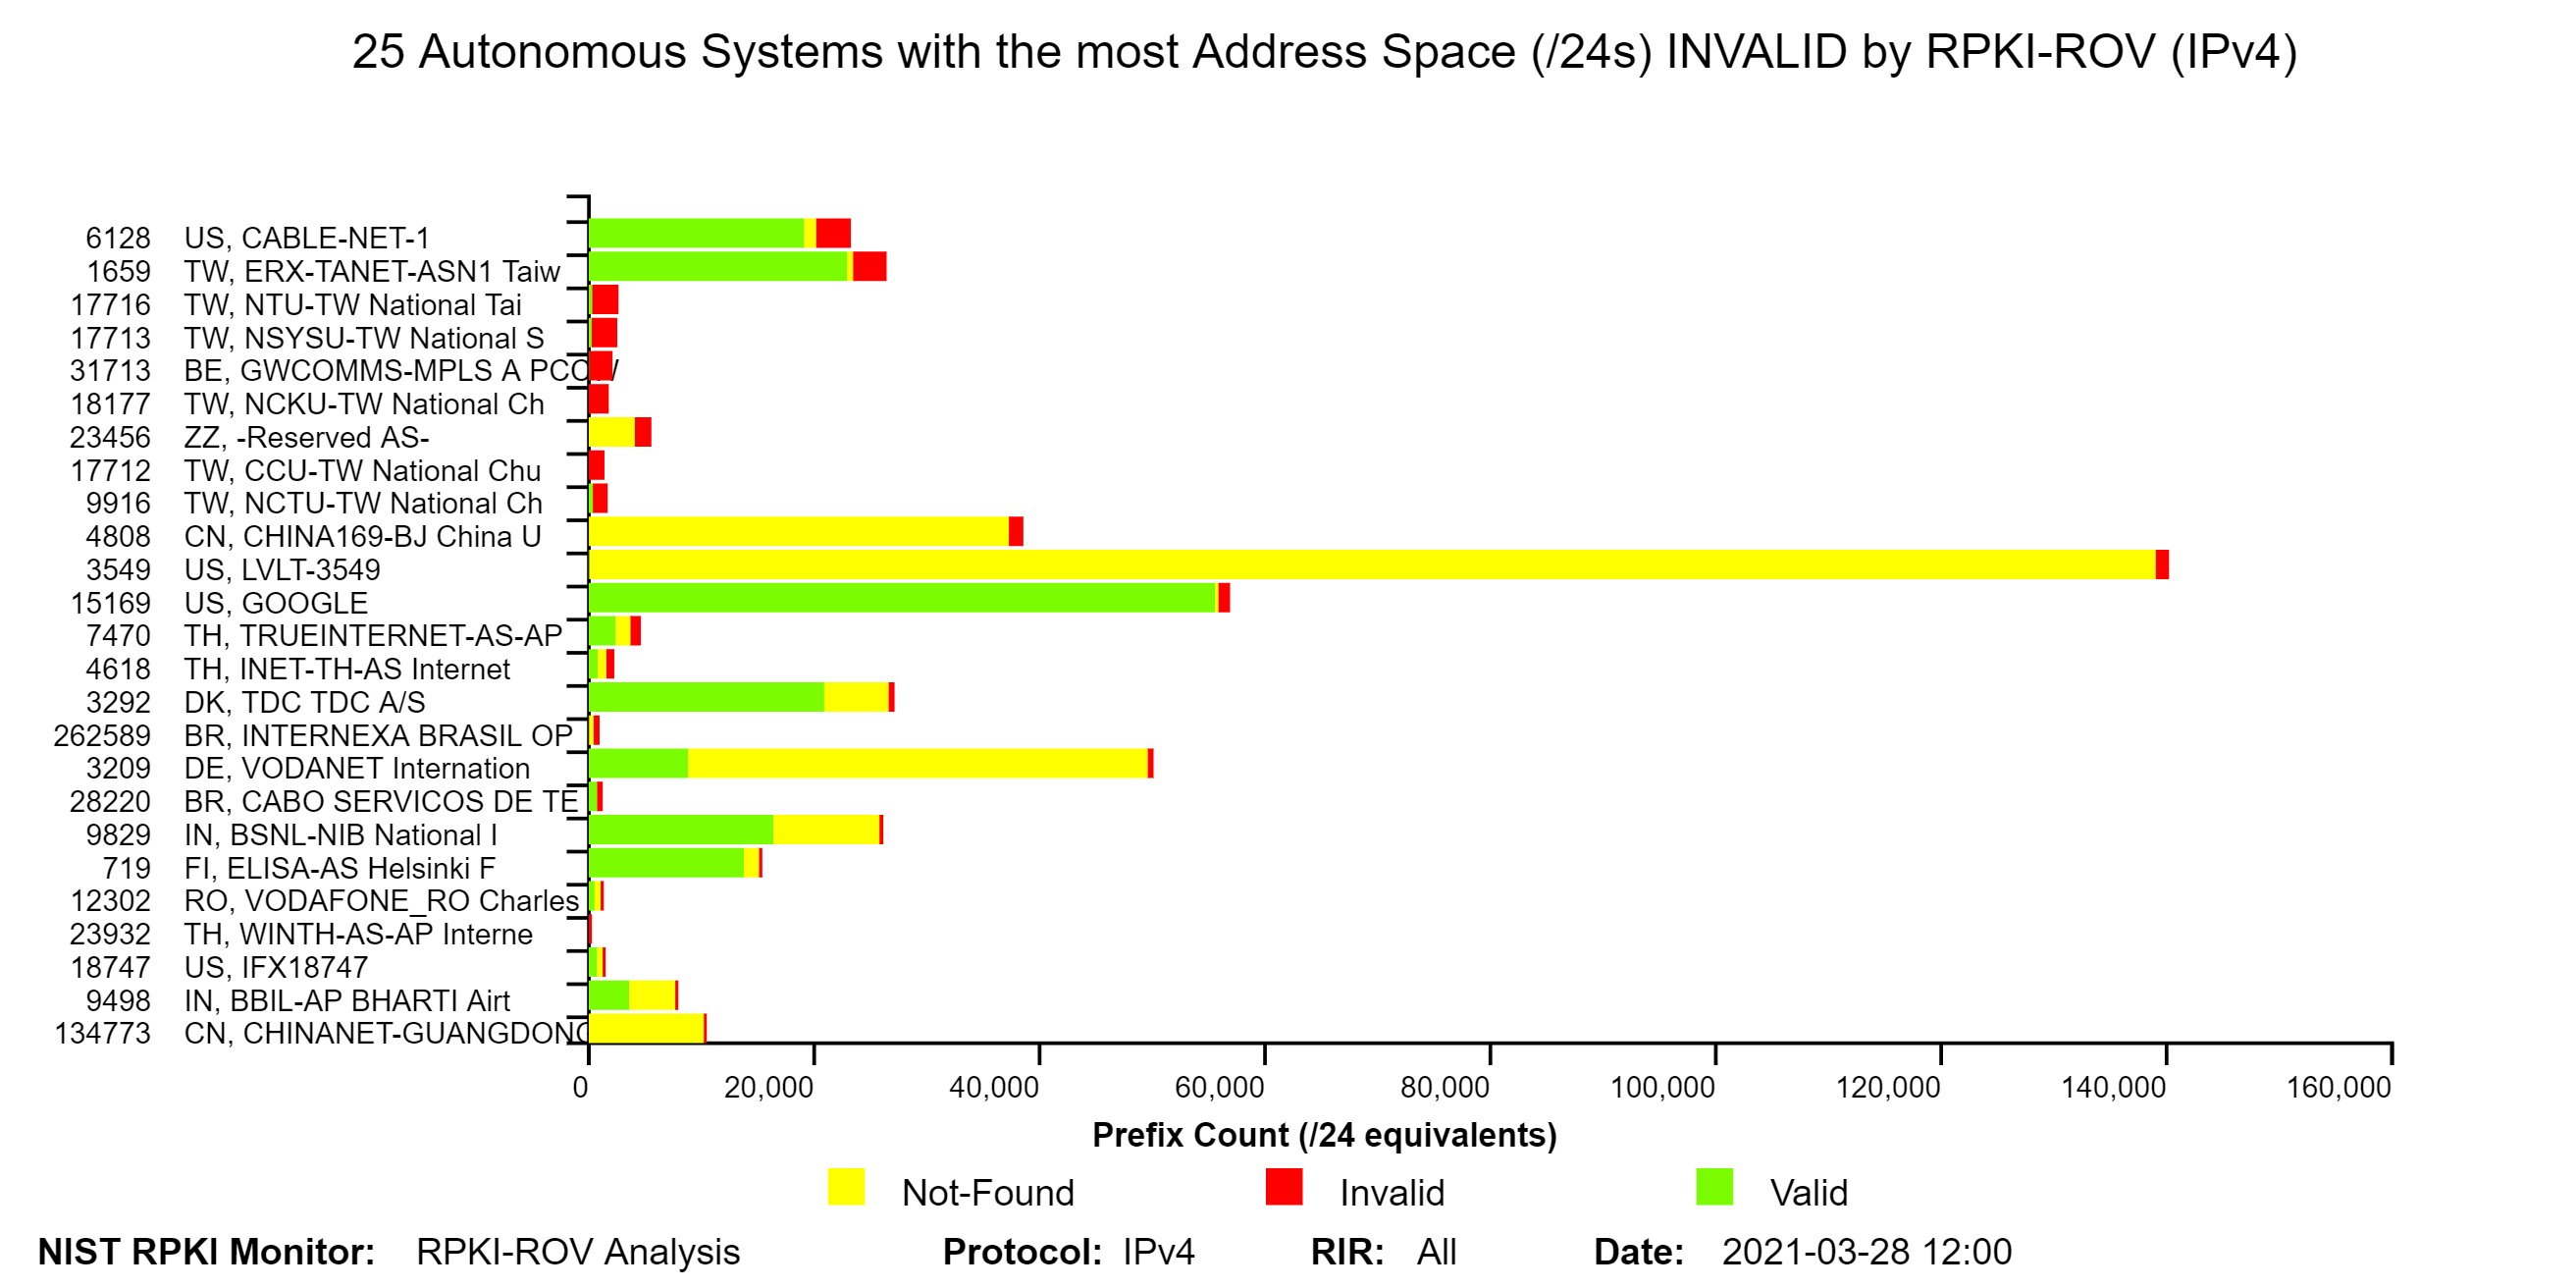
The two graphs below depict the top 25 Autonomous Systems (ASes) with the most IPv4 address space (/24s) Valid by RPKI-ROV and the top 25 ASes with the most IPv4 address space (/24s) Invalid by RPKI-ROV. For each IPv4 prefix-origin pair, the address space is measured in terms of the number of /24s contained in the prefix (jump to this analysis).
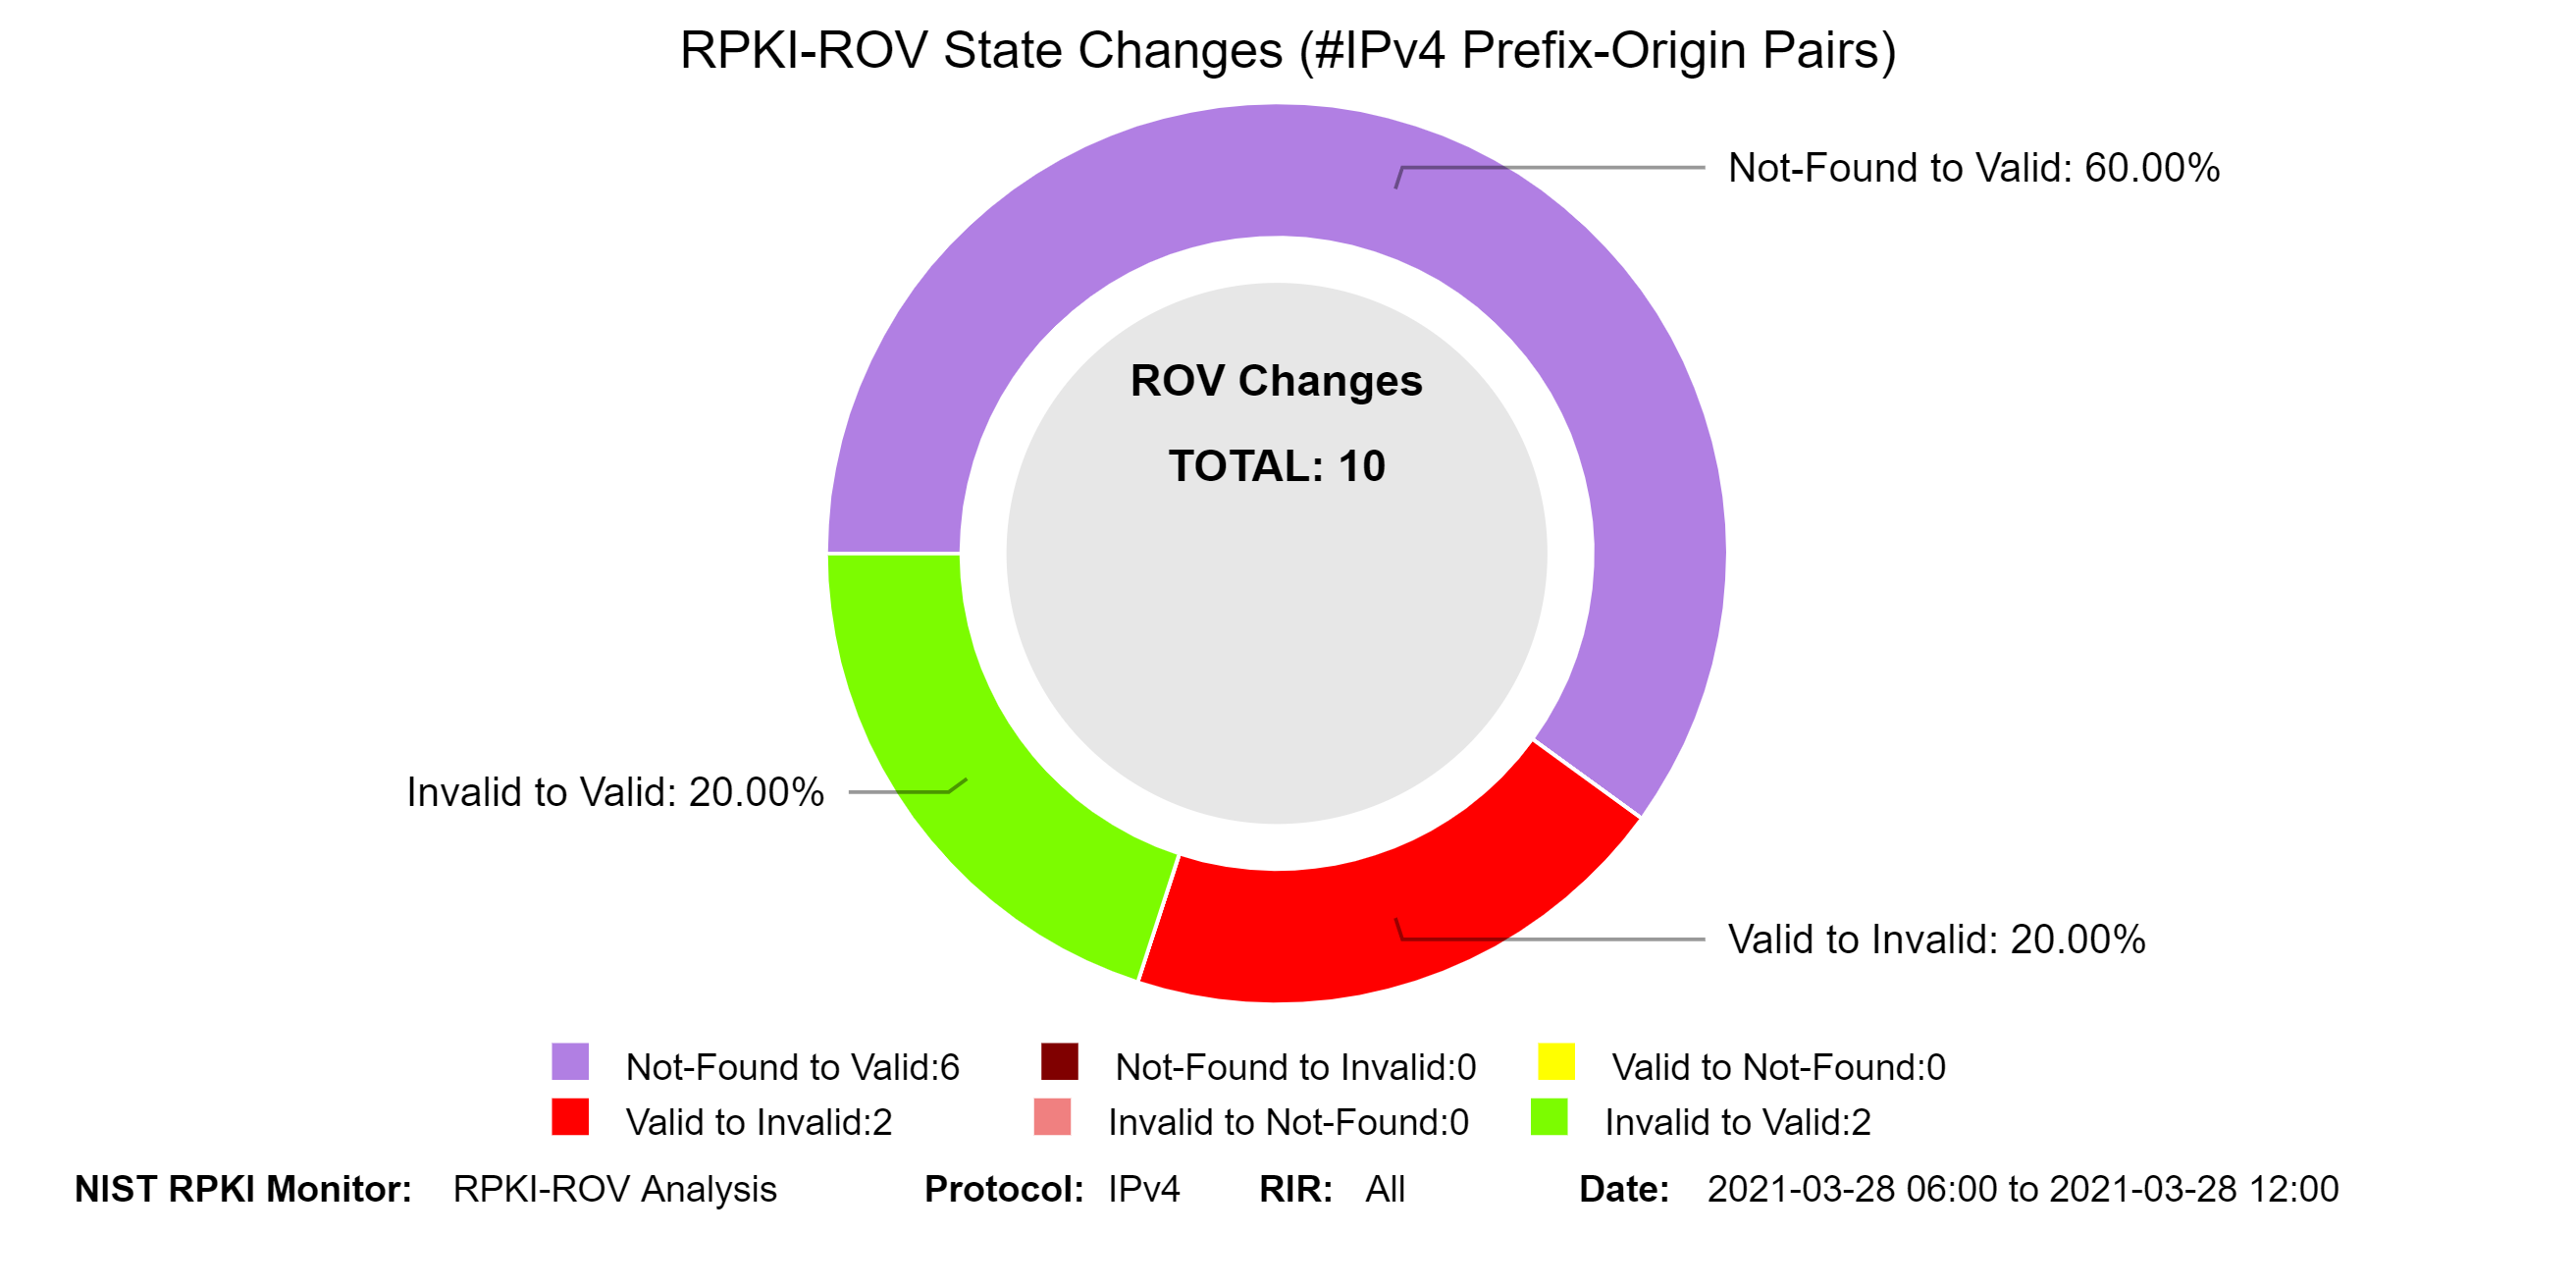
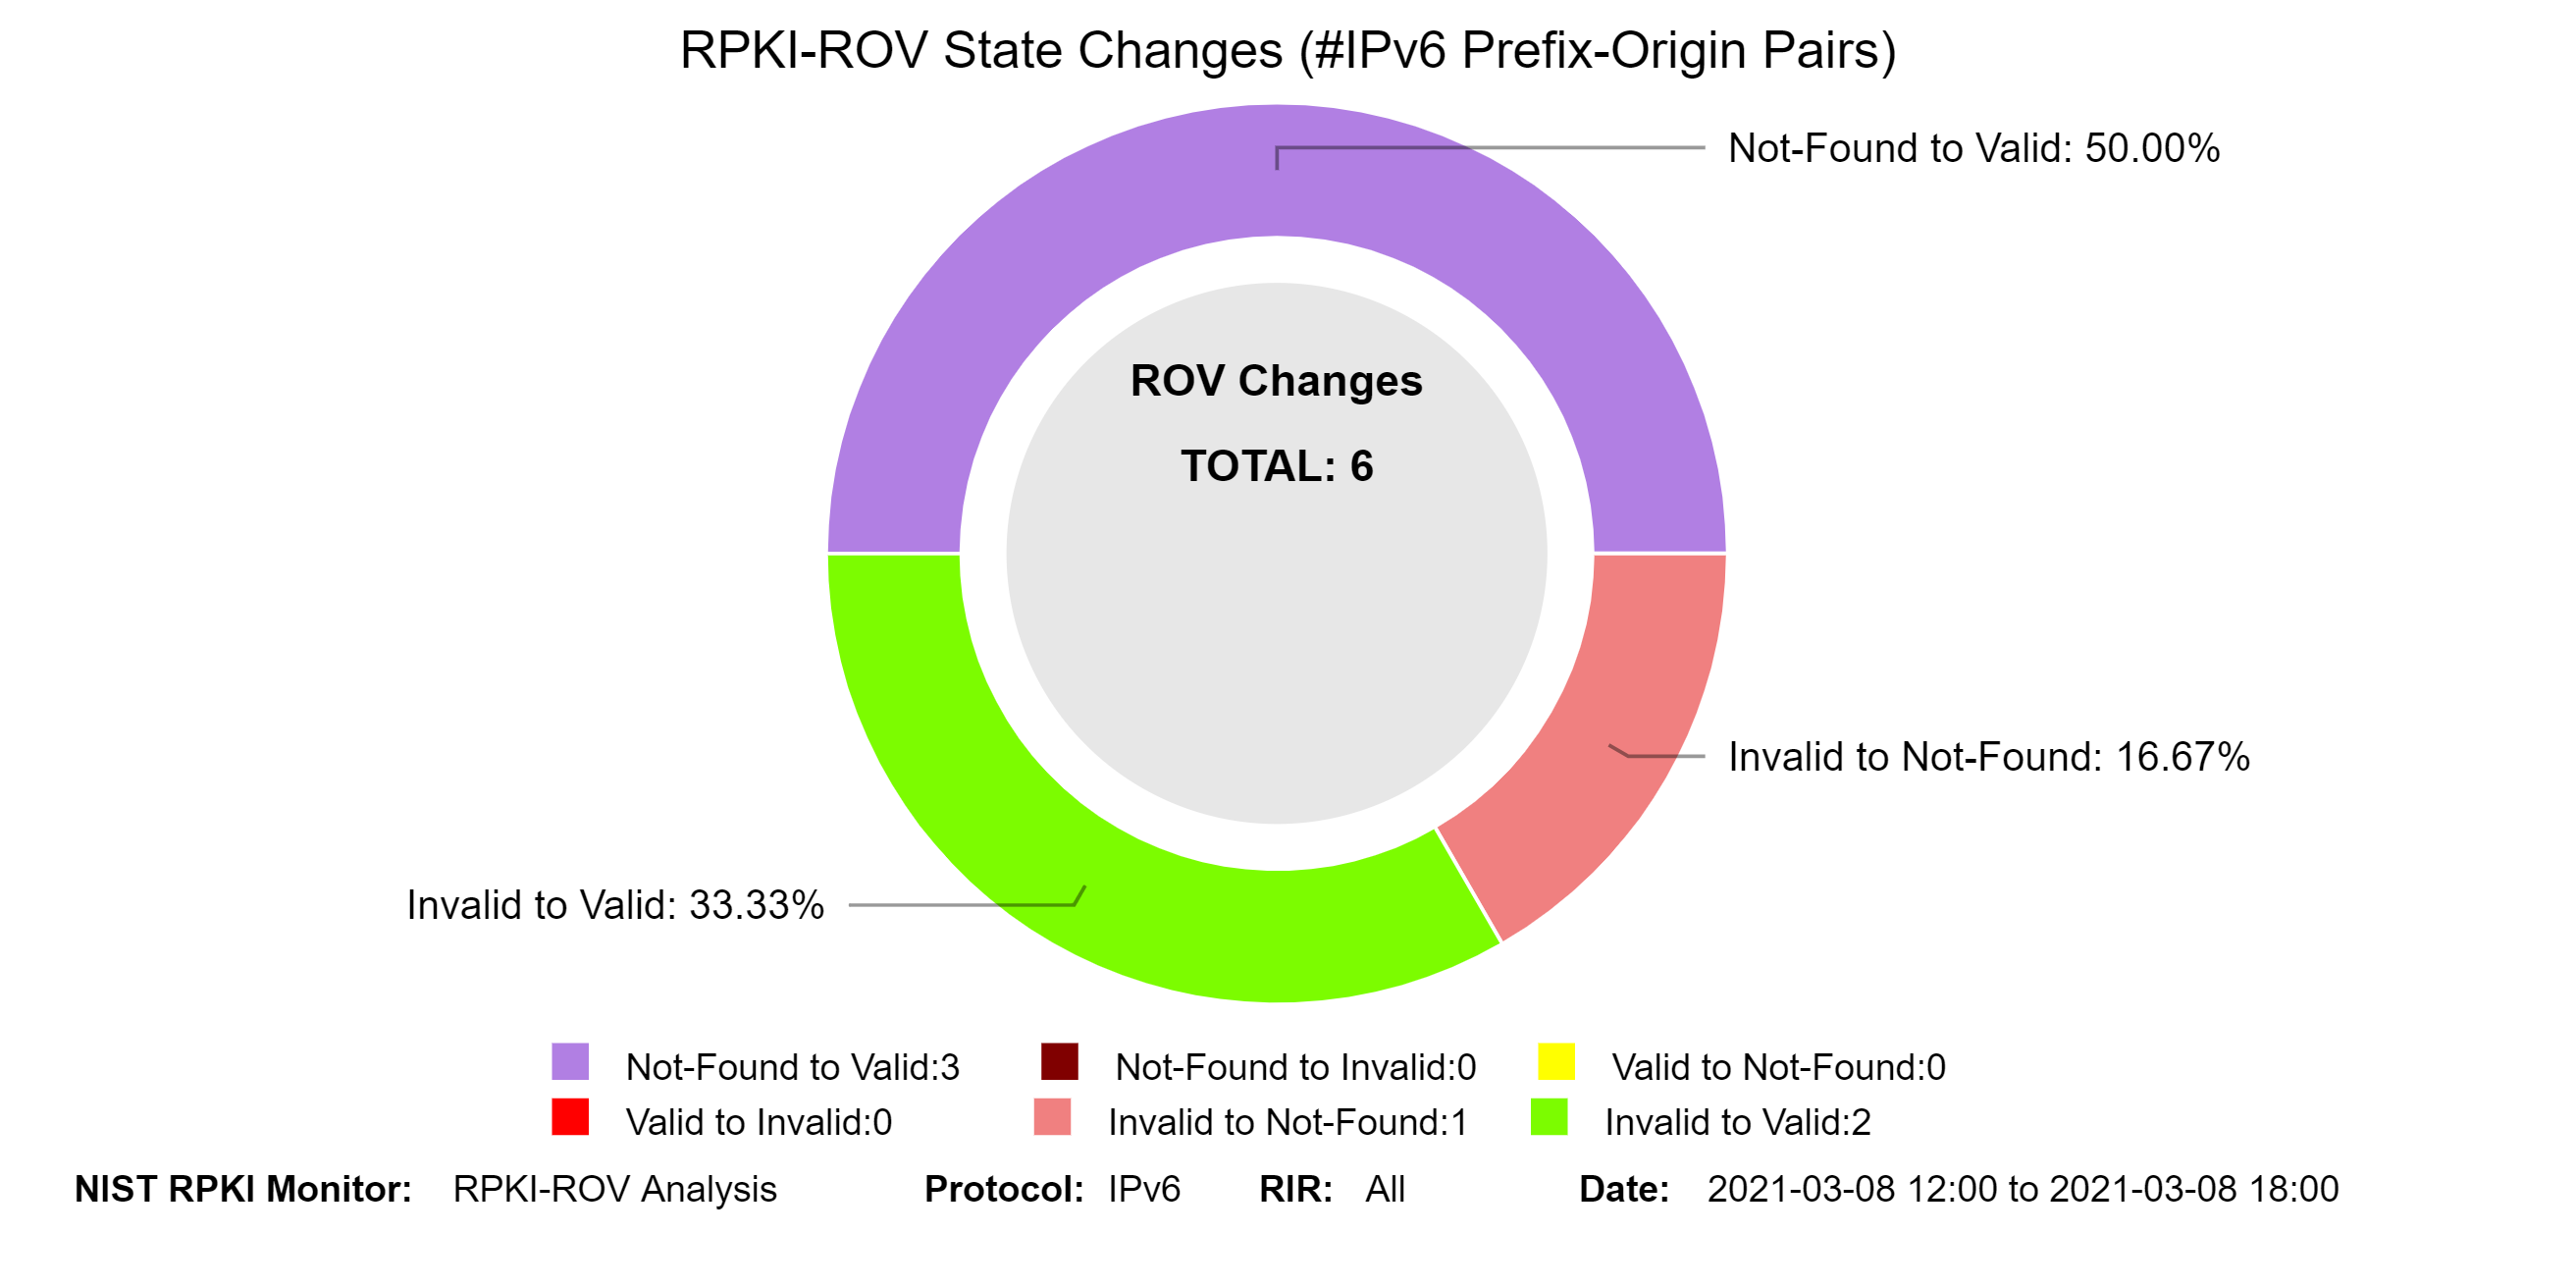
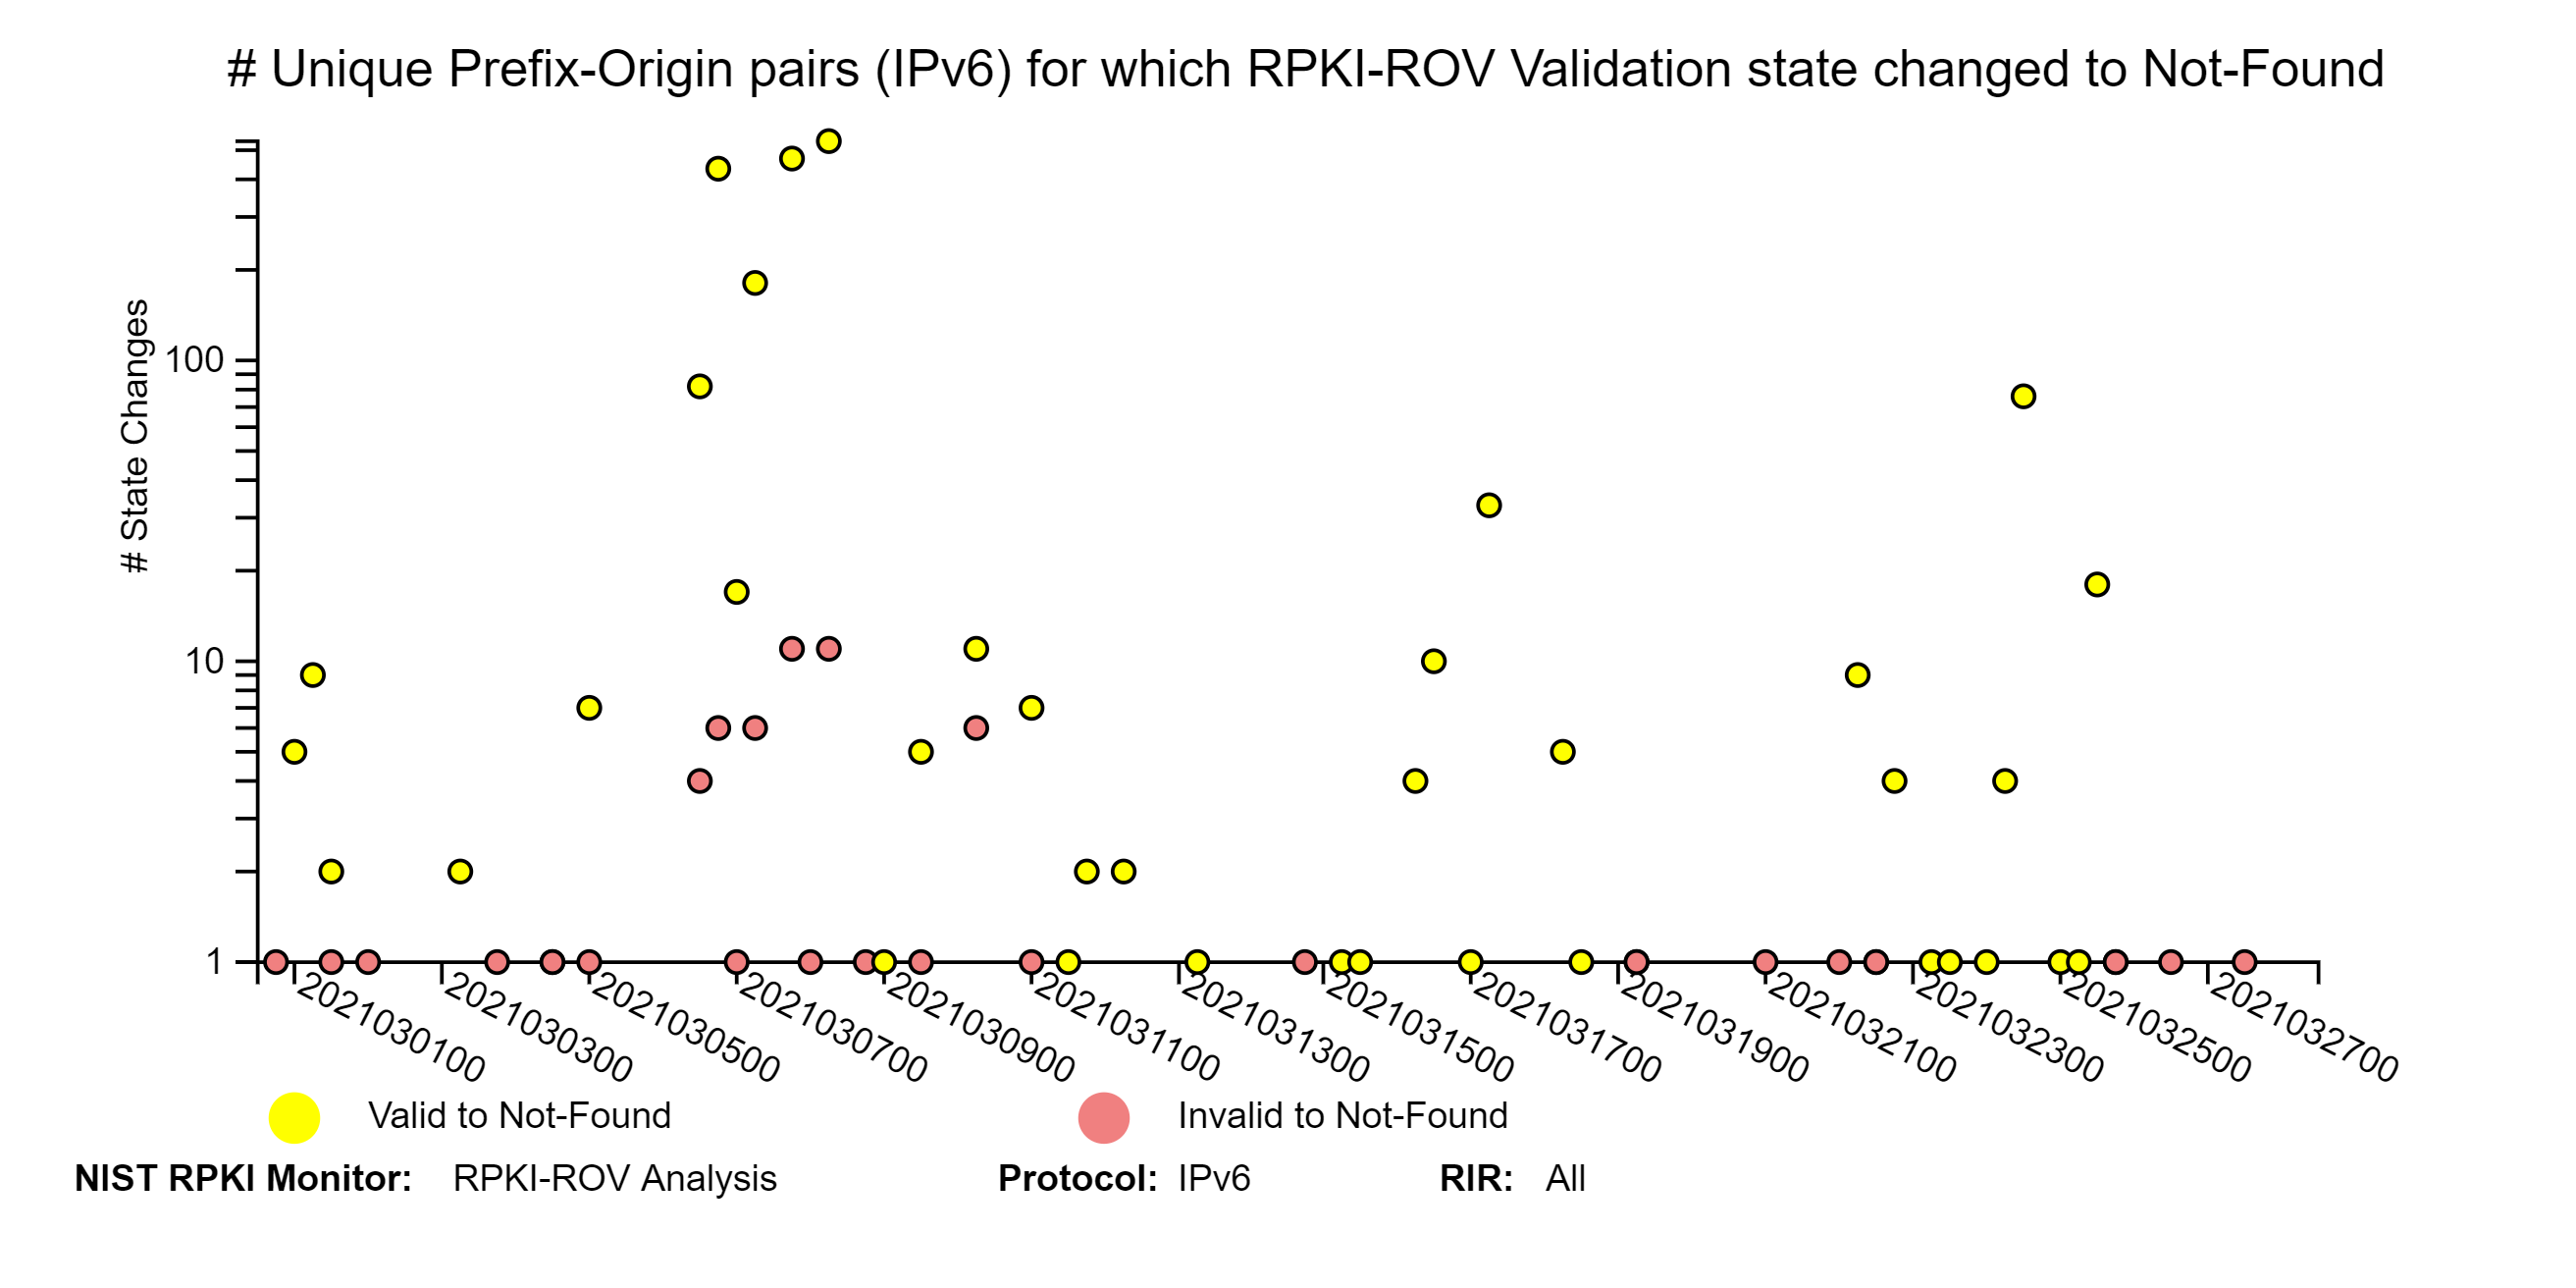
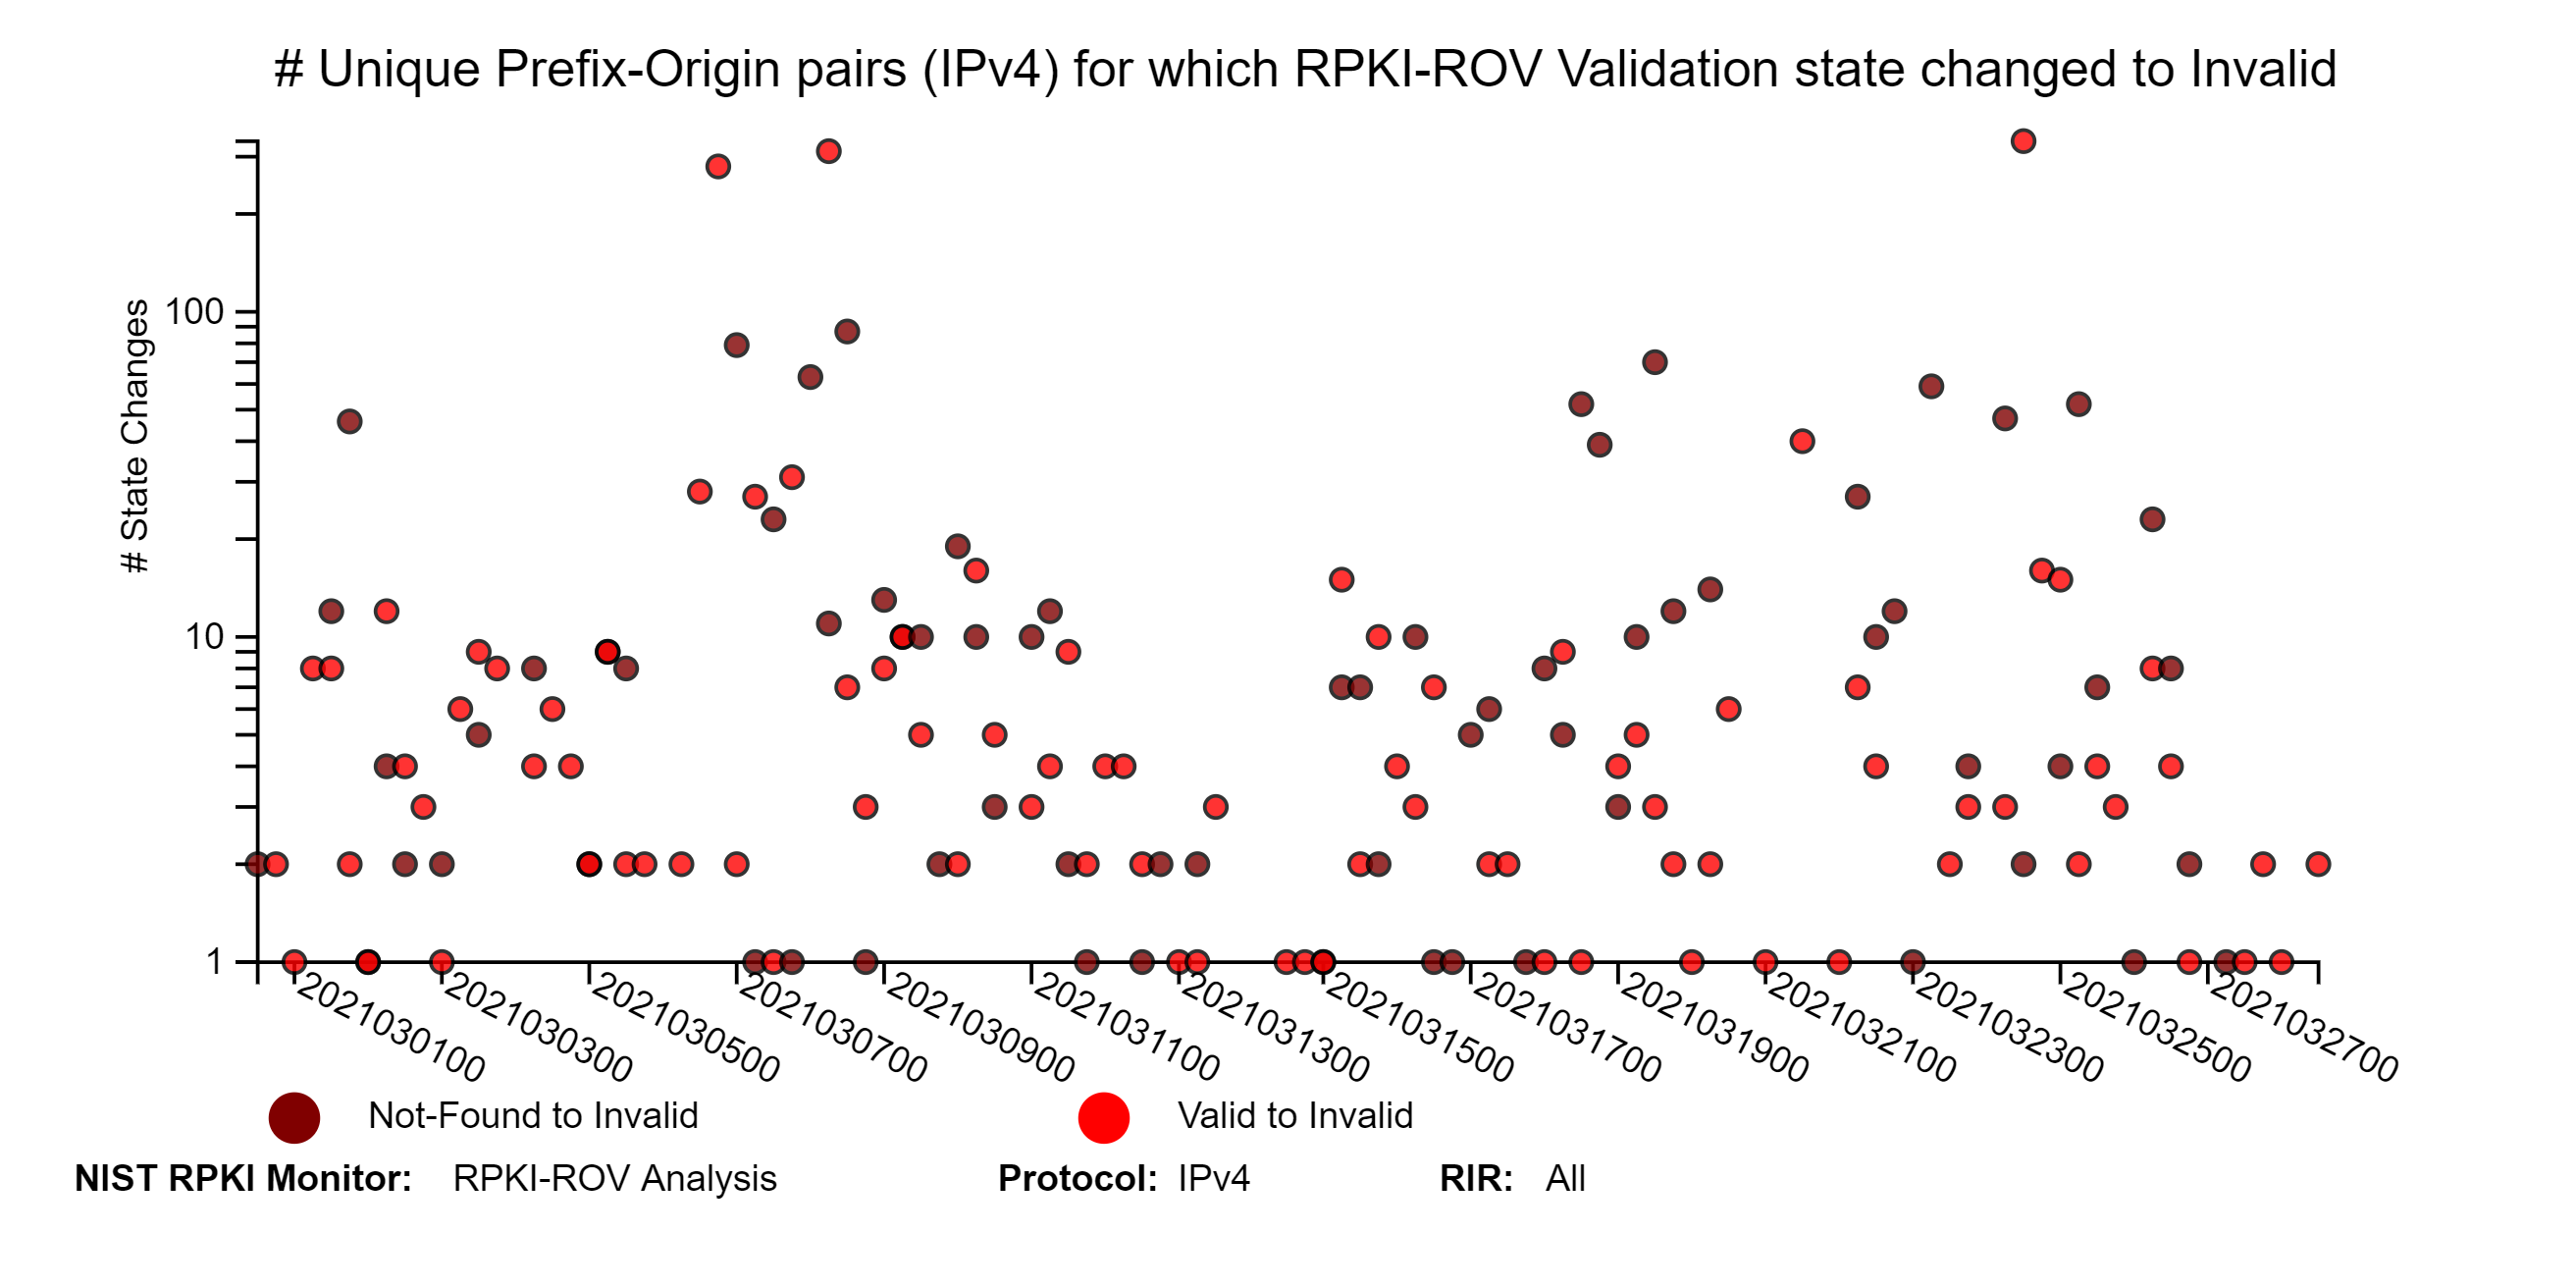
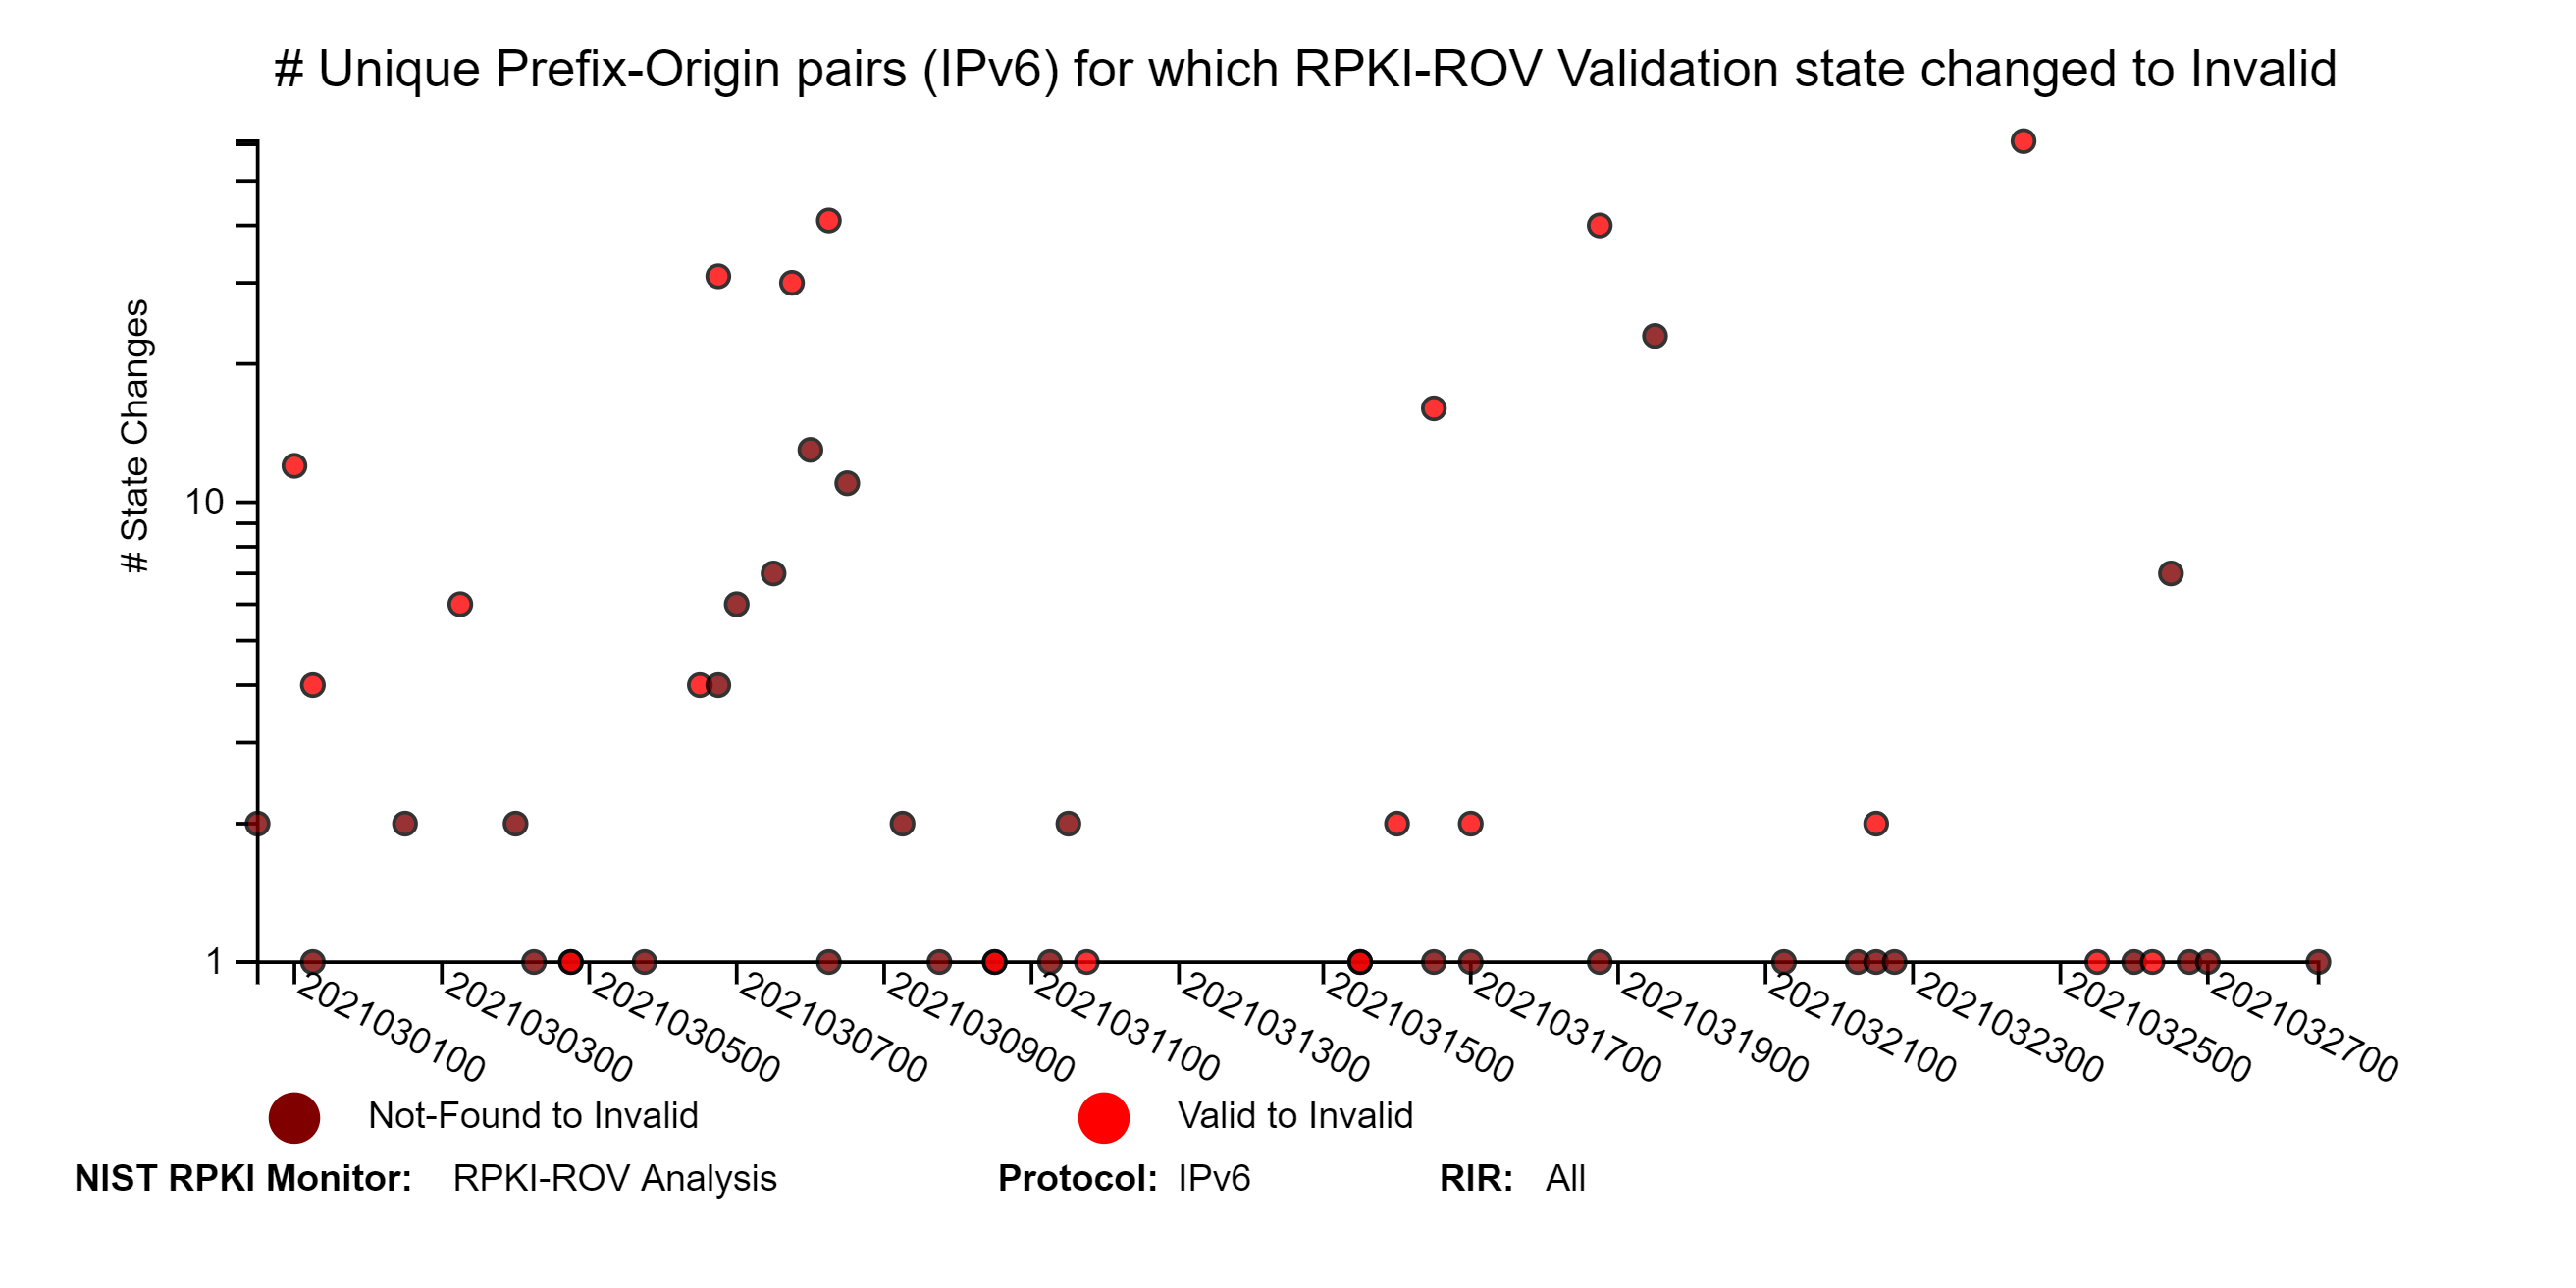
 The graphs below represent snapshots of RPKI-ROV changes for both IPv4 and IPv6 unique Prefix-Origin pairs. The time interval for the changes is shown in the lower right-hand corner (jump to this analysis). A Prefix-Origin pair changes its RPKI-ROV state in one of six possible ways:
- Not-Found to Valid: The Prefix-Origin pair switches from Not-Found (the prefix in BGP was not covered by any ROA prefix) to Valid (there exists a ROA such that the prefix in BGP is covered by a prefix in the ROA; max-Length satisfied and AS match).
- Not-Found to Invalid: The Prefix-Origin pair switches from Not-Found to Invalid (there exists a ROA such that the prefix in BGP is covered by a prefix in the ROA; either max-Length exceeded, or AS mismatch, or both).
- Valid to Not-Found: The Prefix-Origin pair switches from Valid to Not-Found.
- Valid to Invalid: The Prefix-Origin pair switches from Valid to Invalid.
- Invalid to Not-Found: The Prefix-Origin pair switches from Invalid to Not-Found.
- Invalid to Valid: The Prefix-Origin pair switches from Invalid to Valid.
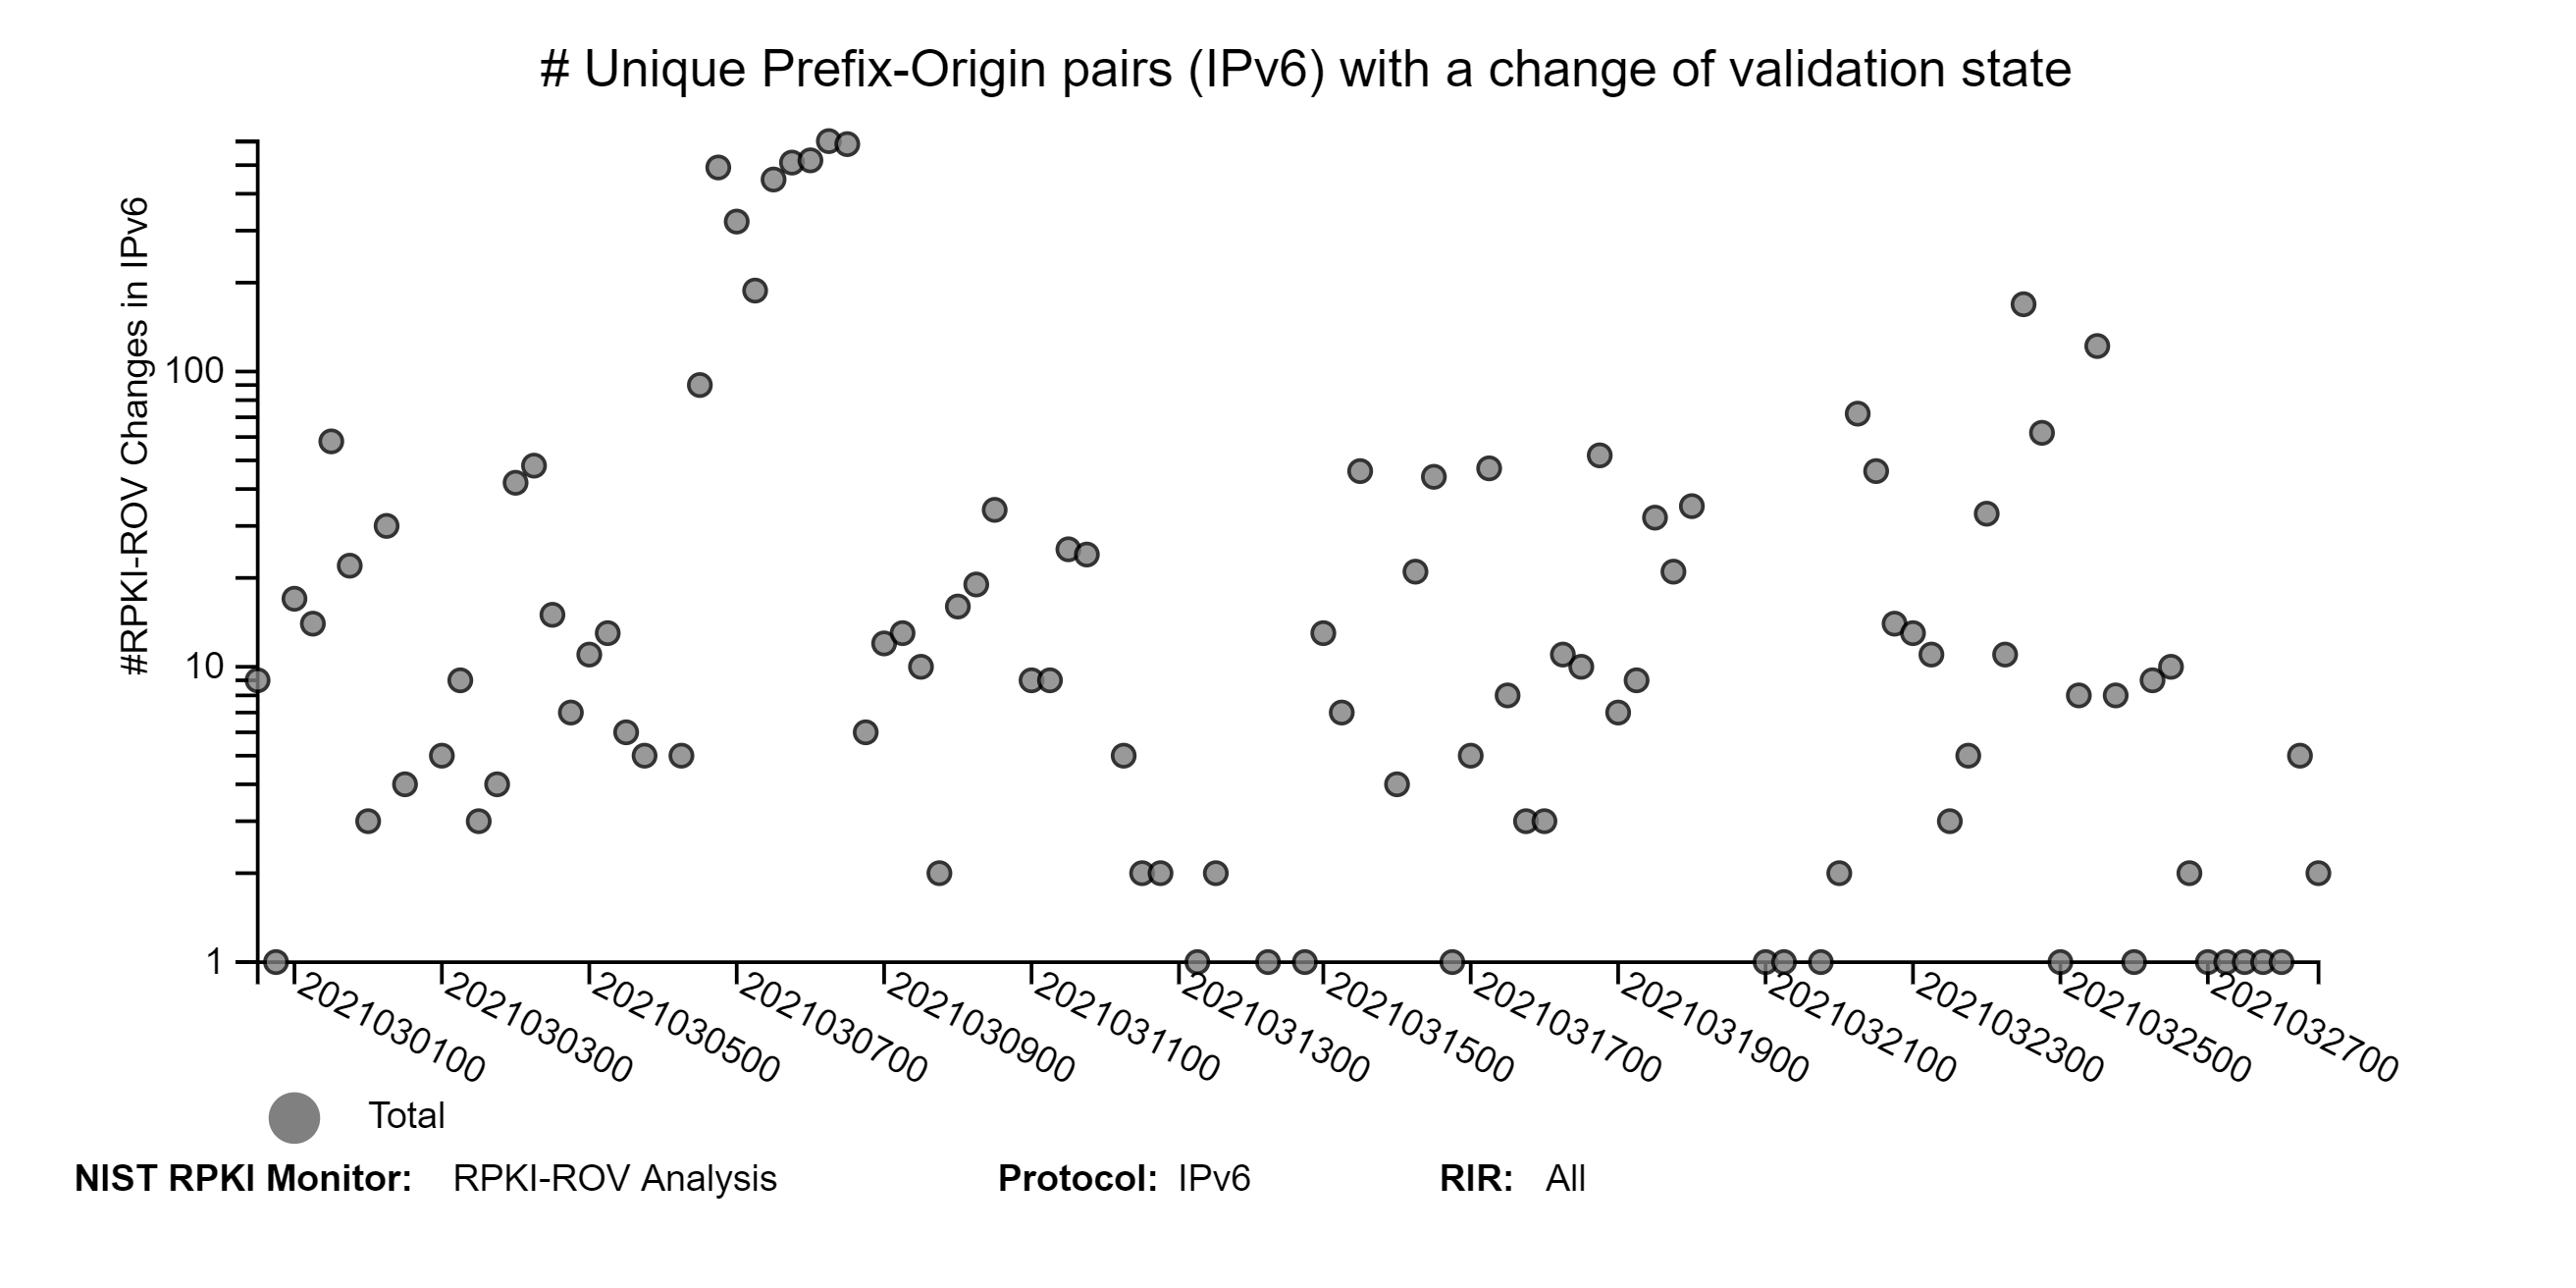
 The graphs below depict the history of RPKI-ROV changes for unique IPv4 and IPv6 Prefix-Origin pairs (jump to this analysis). Currently, the changes are observed at six-hour intervals (four times daily).
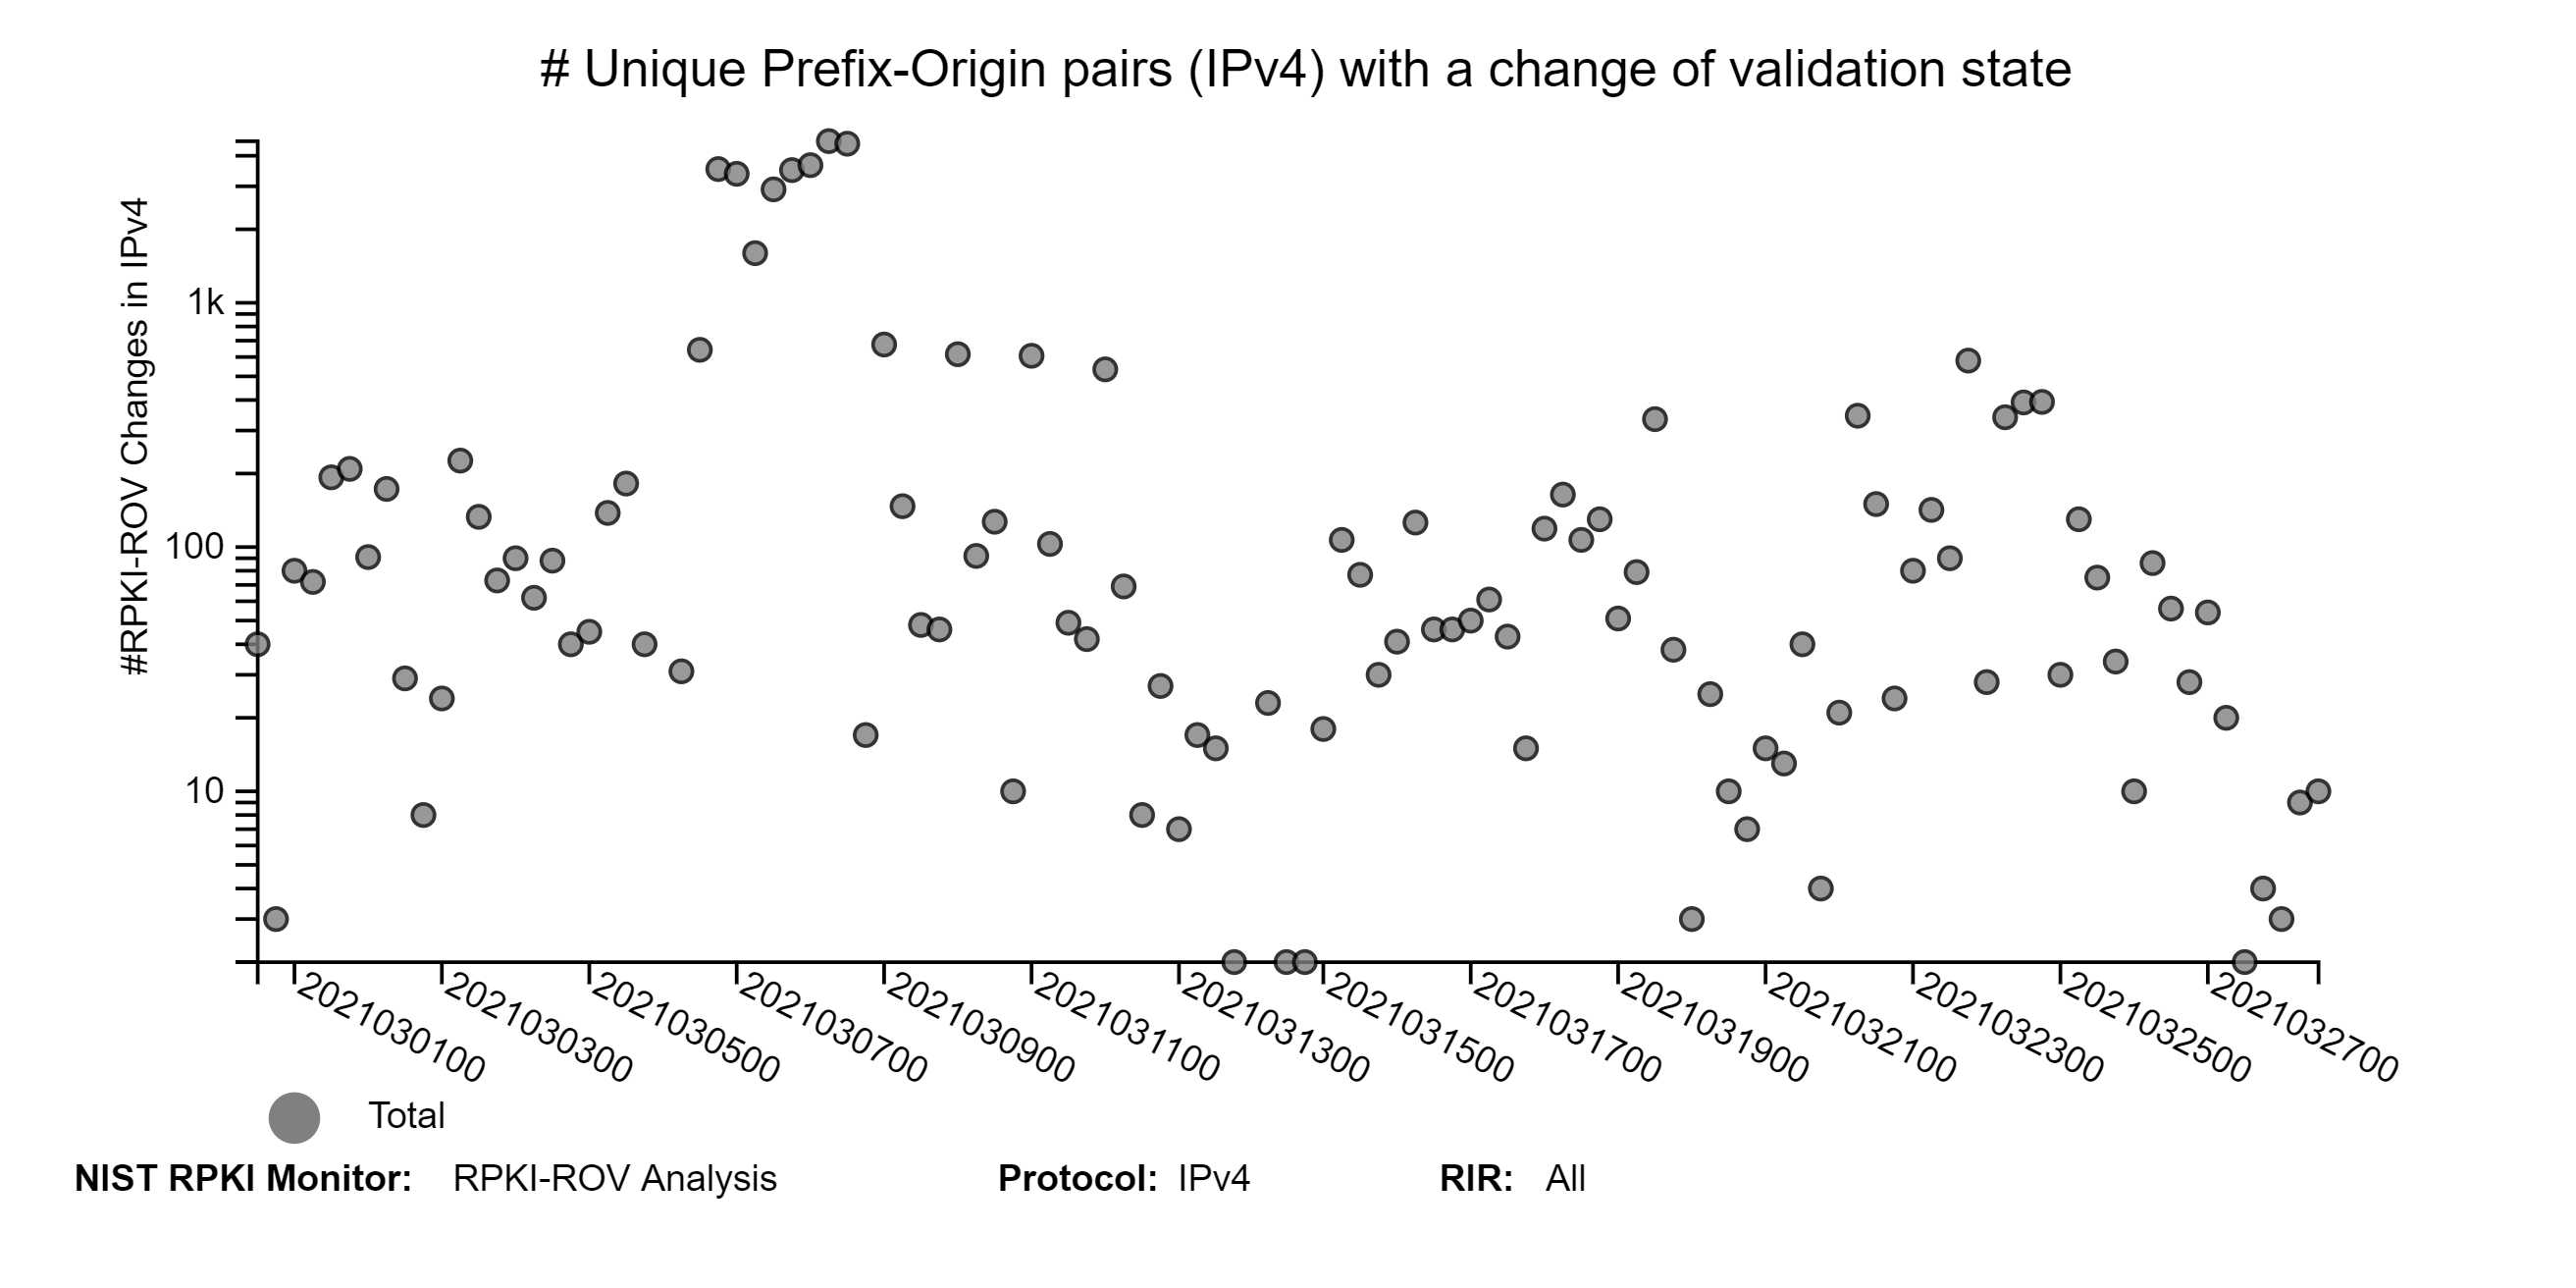
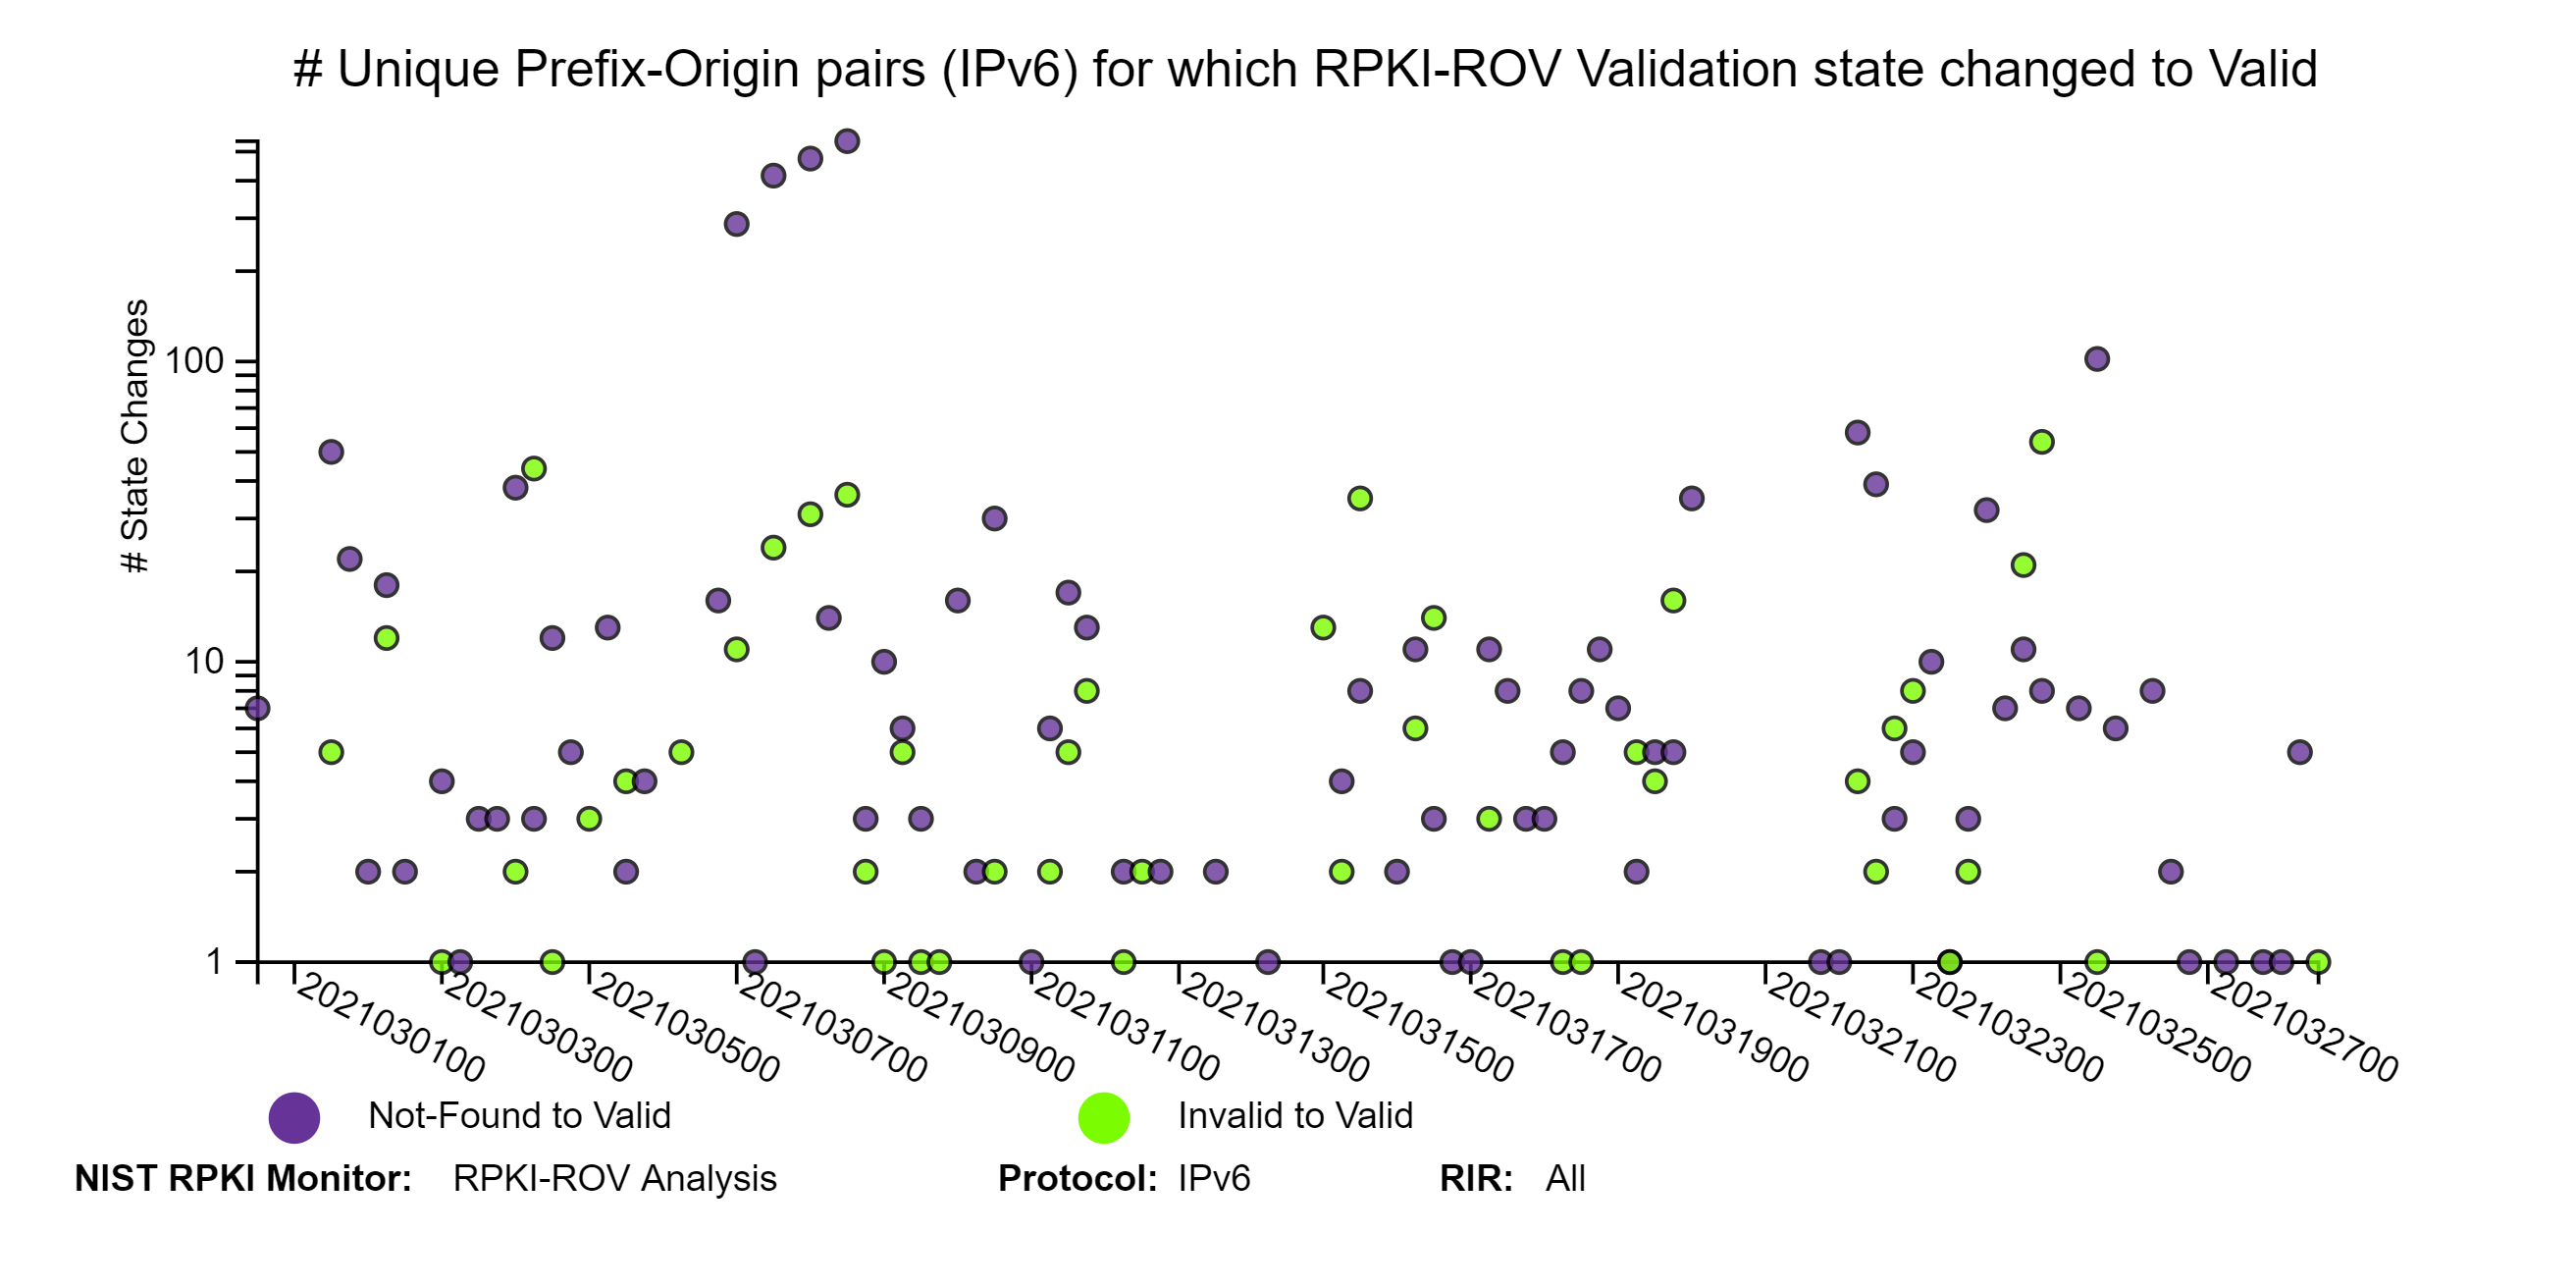
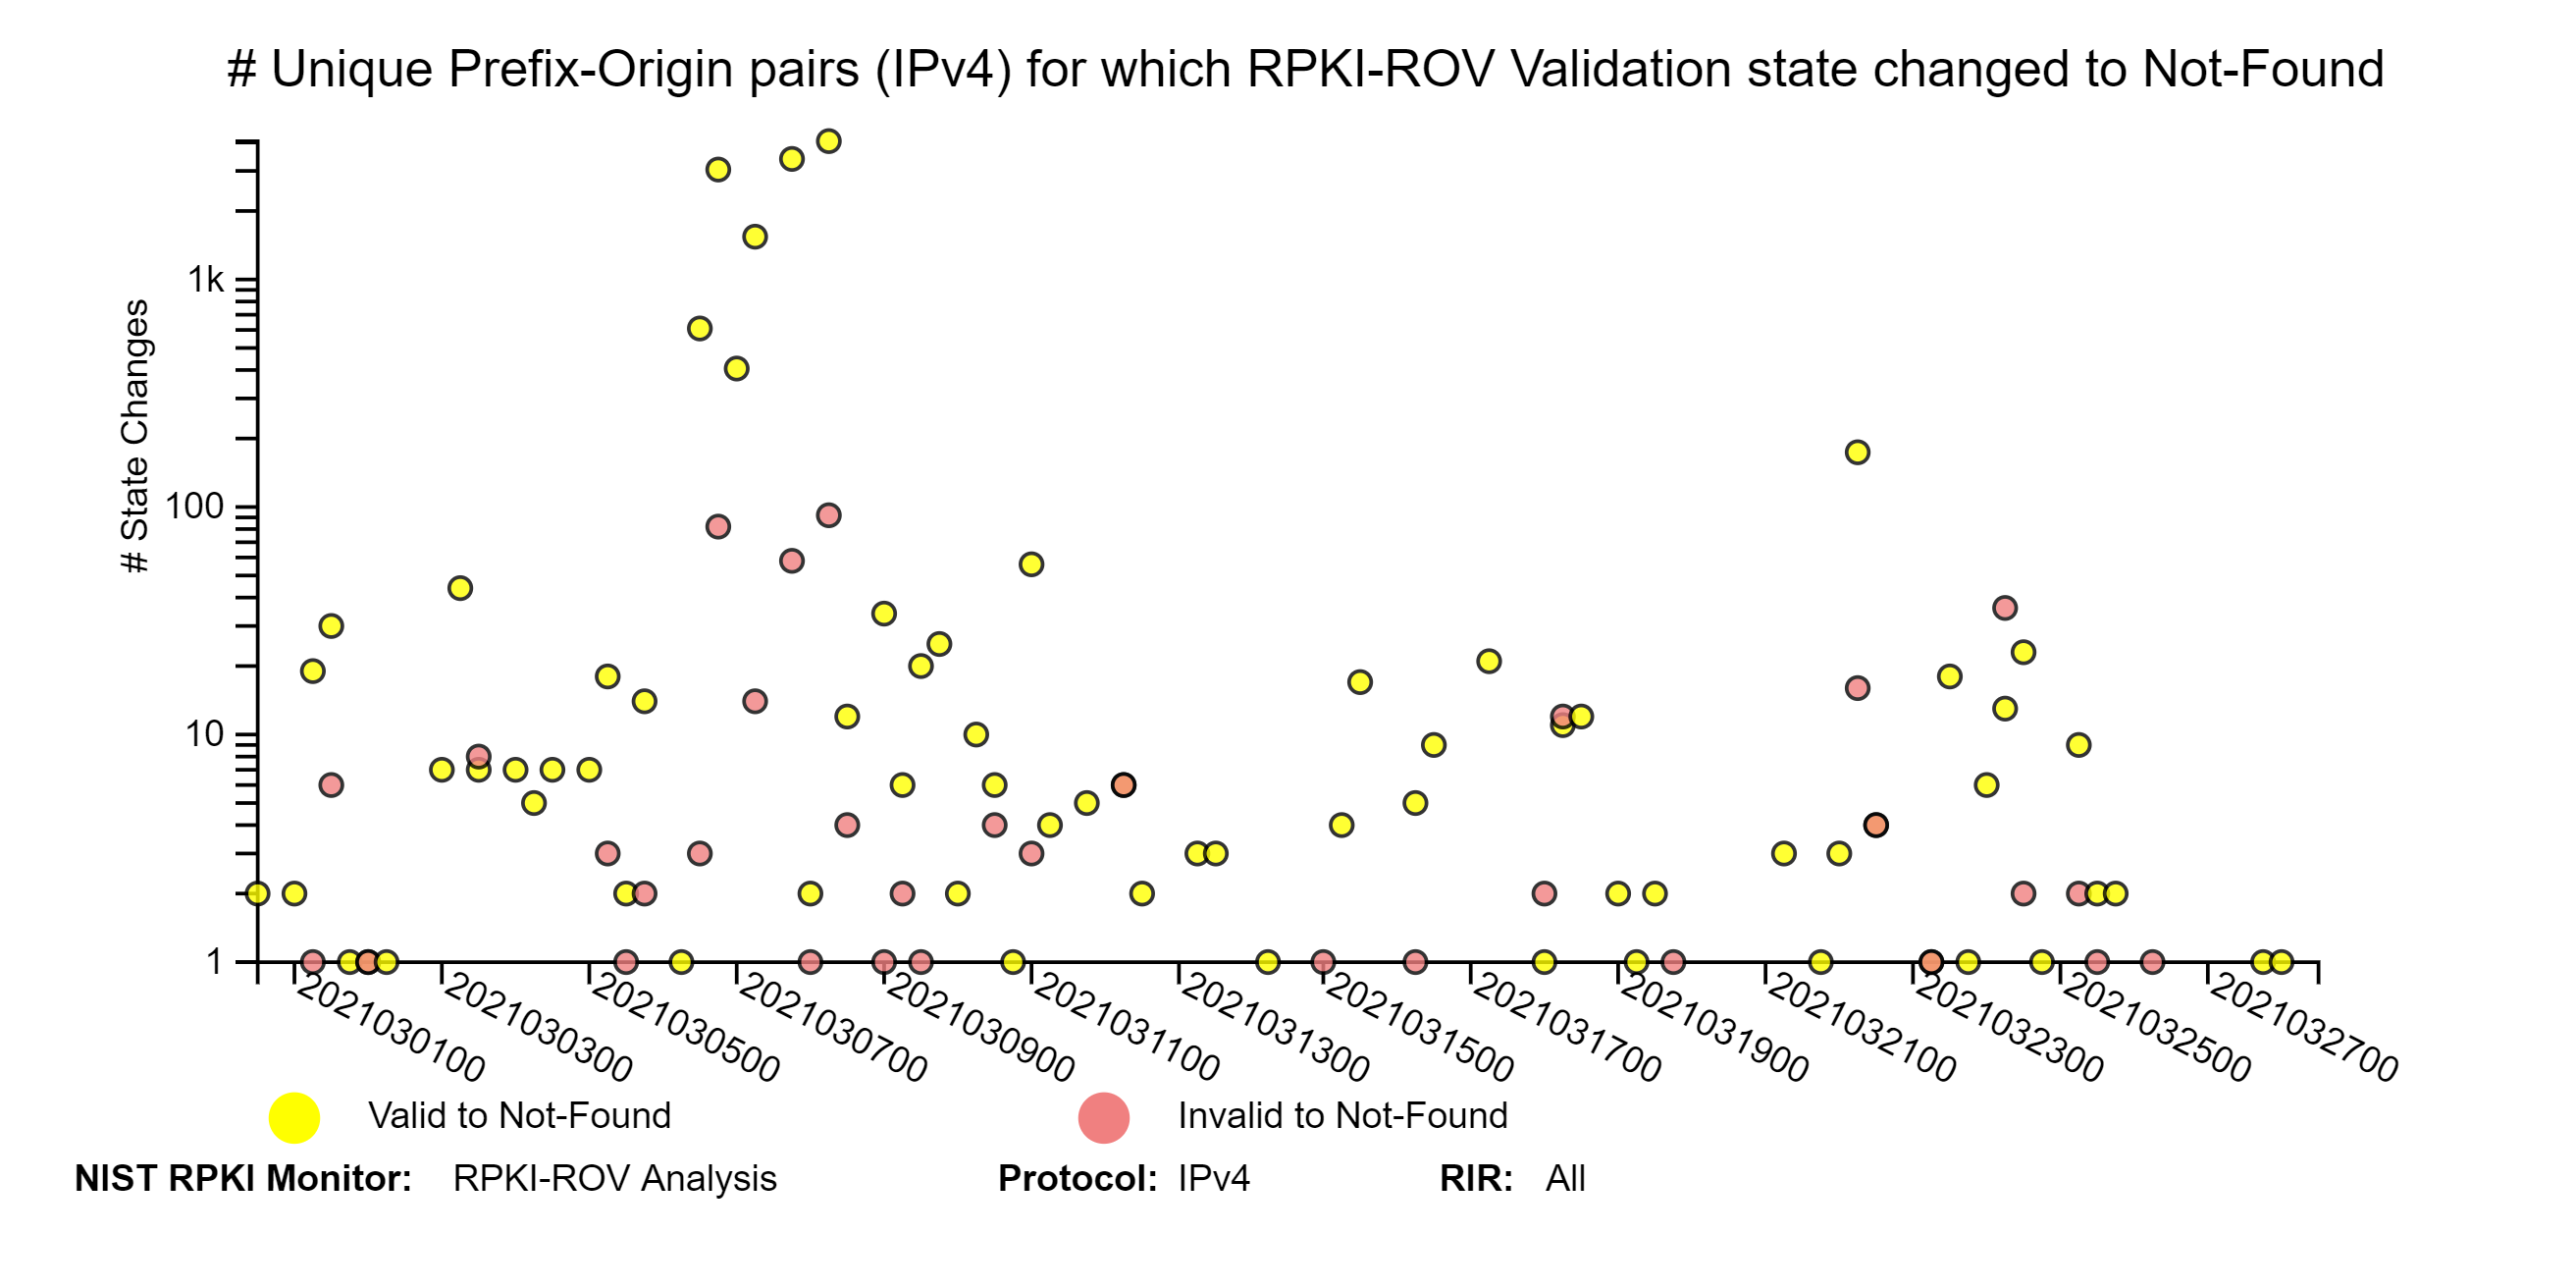
 The graphs below depict details of RPKI-ROV changes history for unique Prefix-Origin pairs. The three sets of IPv4 and IPv6 graphs below correspond to changes from (1) Invalid or Not-Found to Valid; (2) Valid or Invalid to Not-Found; and (3) Valid or Not-Found to Invalid (jump to this analysis).
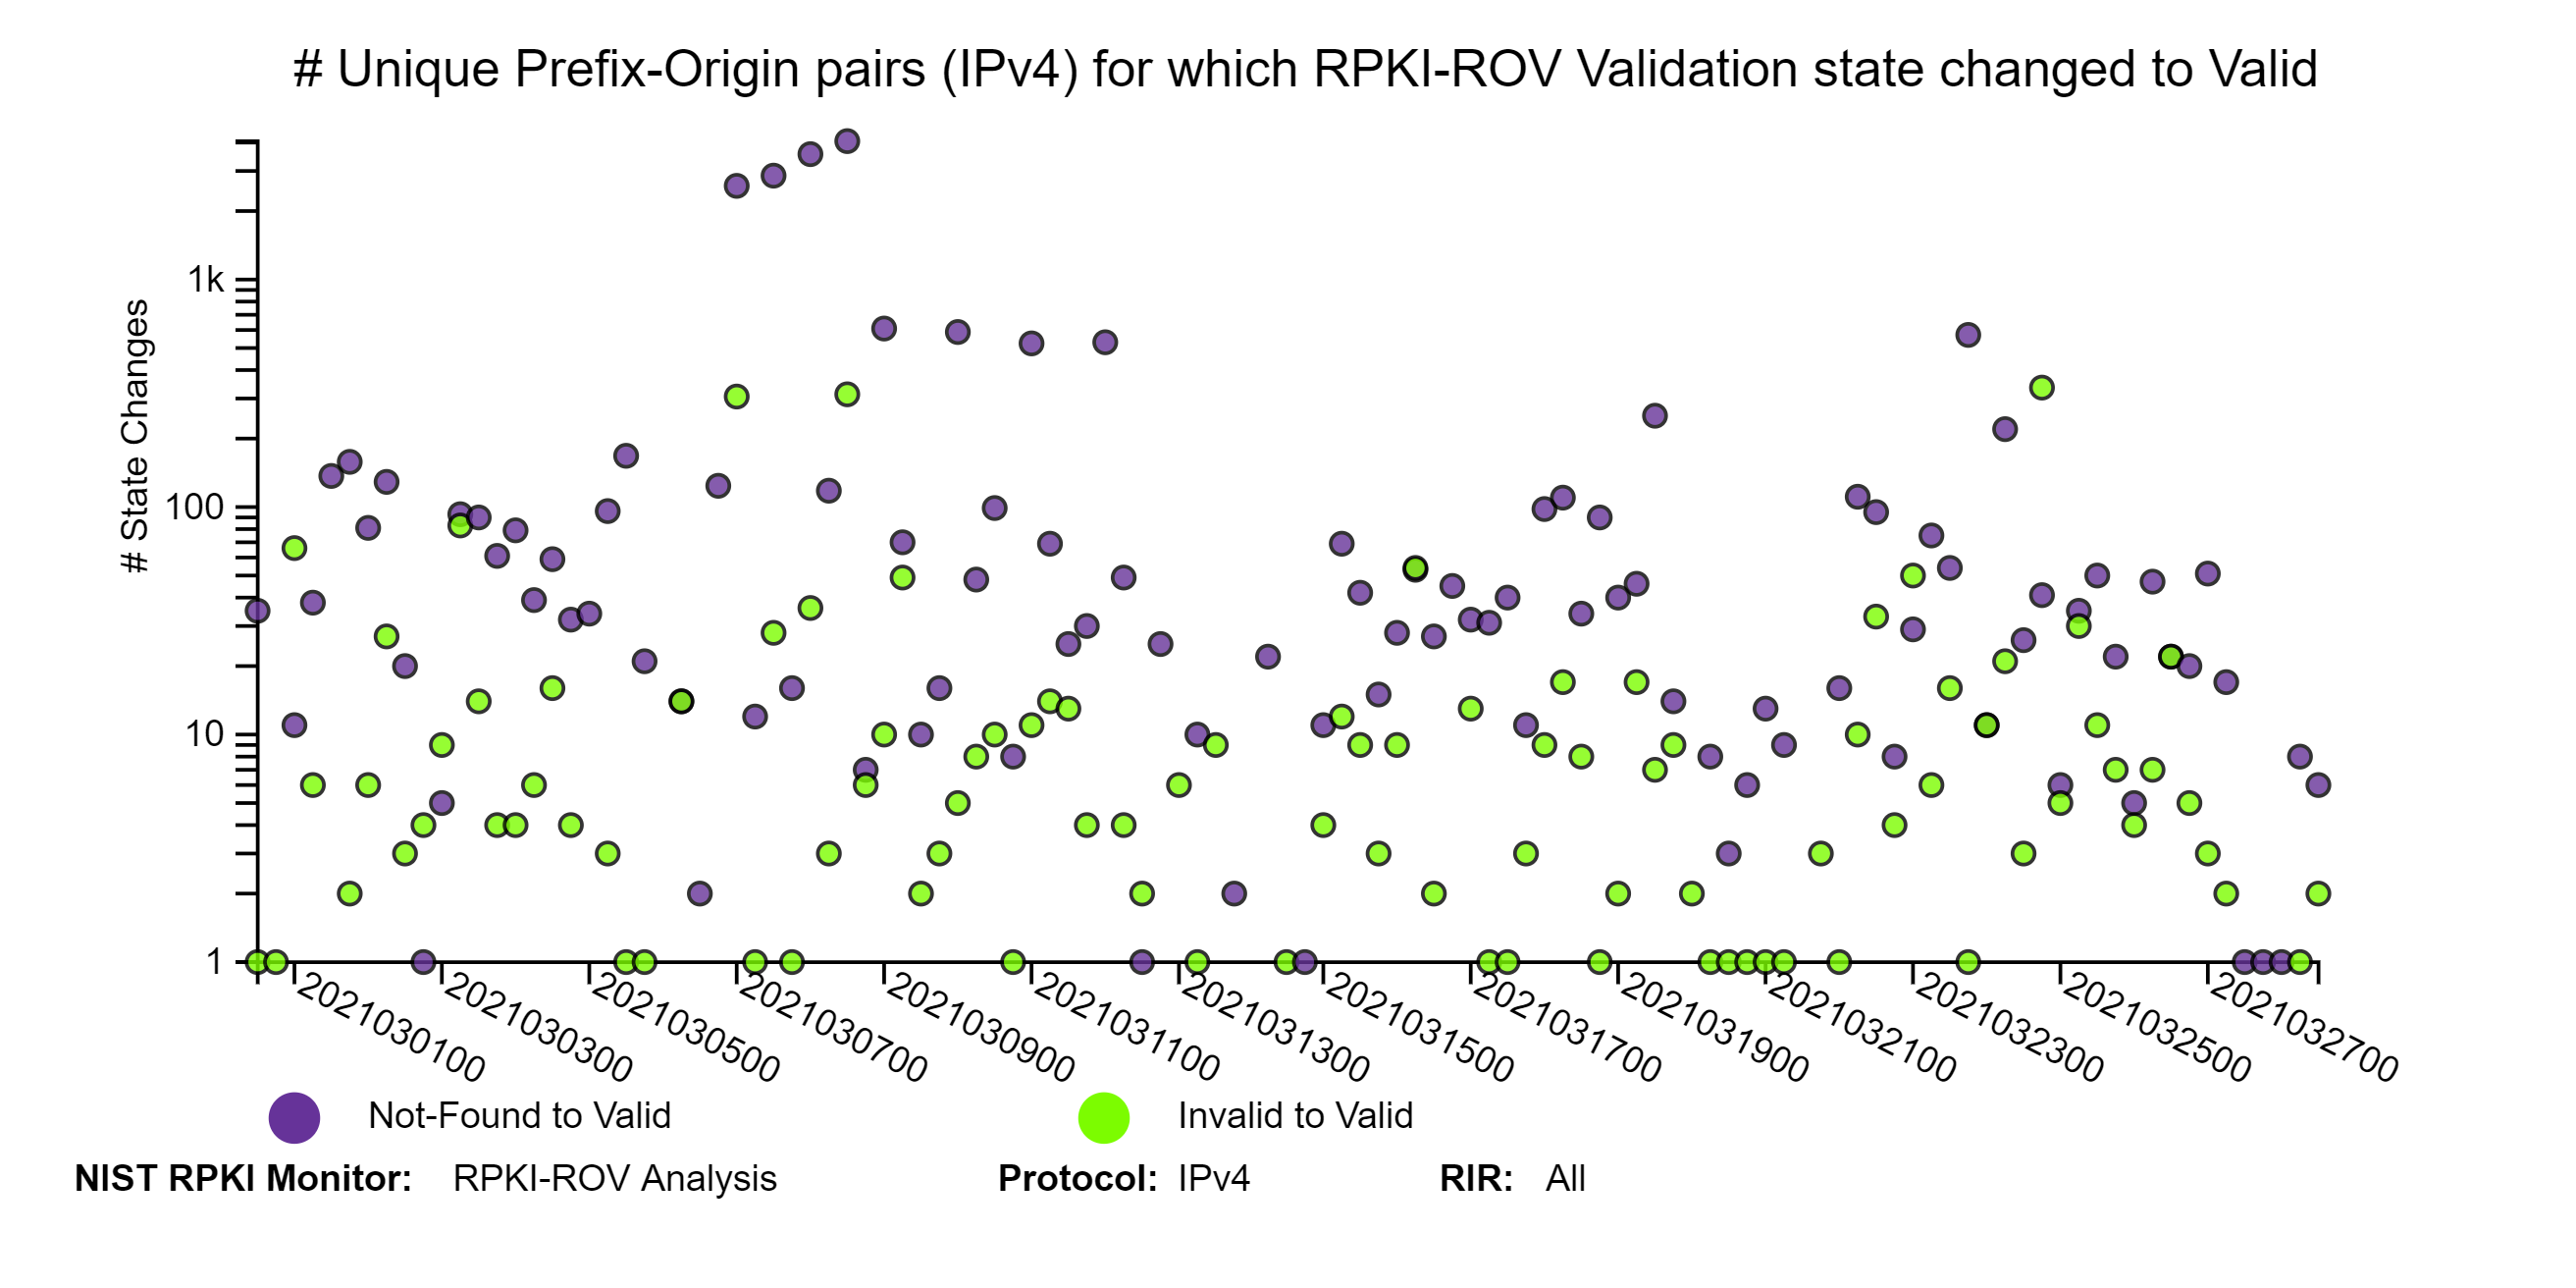
 RPKI Monitor 2.0 allows users to get a specific set of analyses for a particular RIR. As an example, the graphs below represent snapshots of RPKI-ROV changes for both IPv4 and IPv6 unique Prefix-Origin pairs in ARIN.
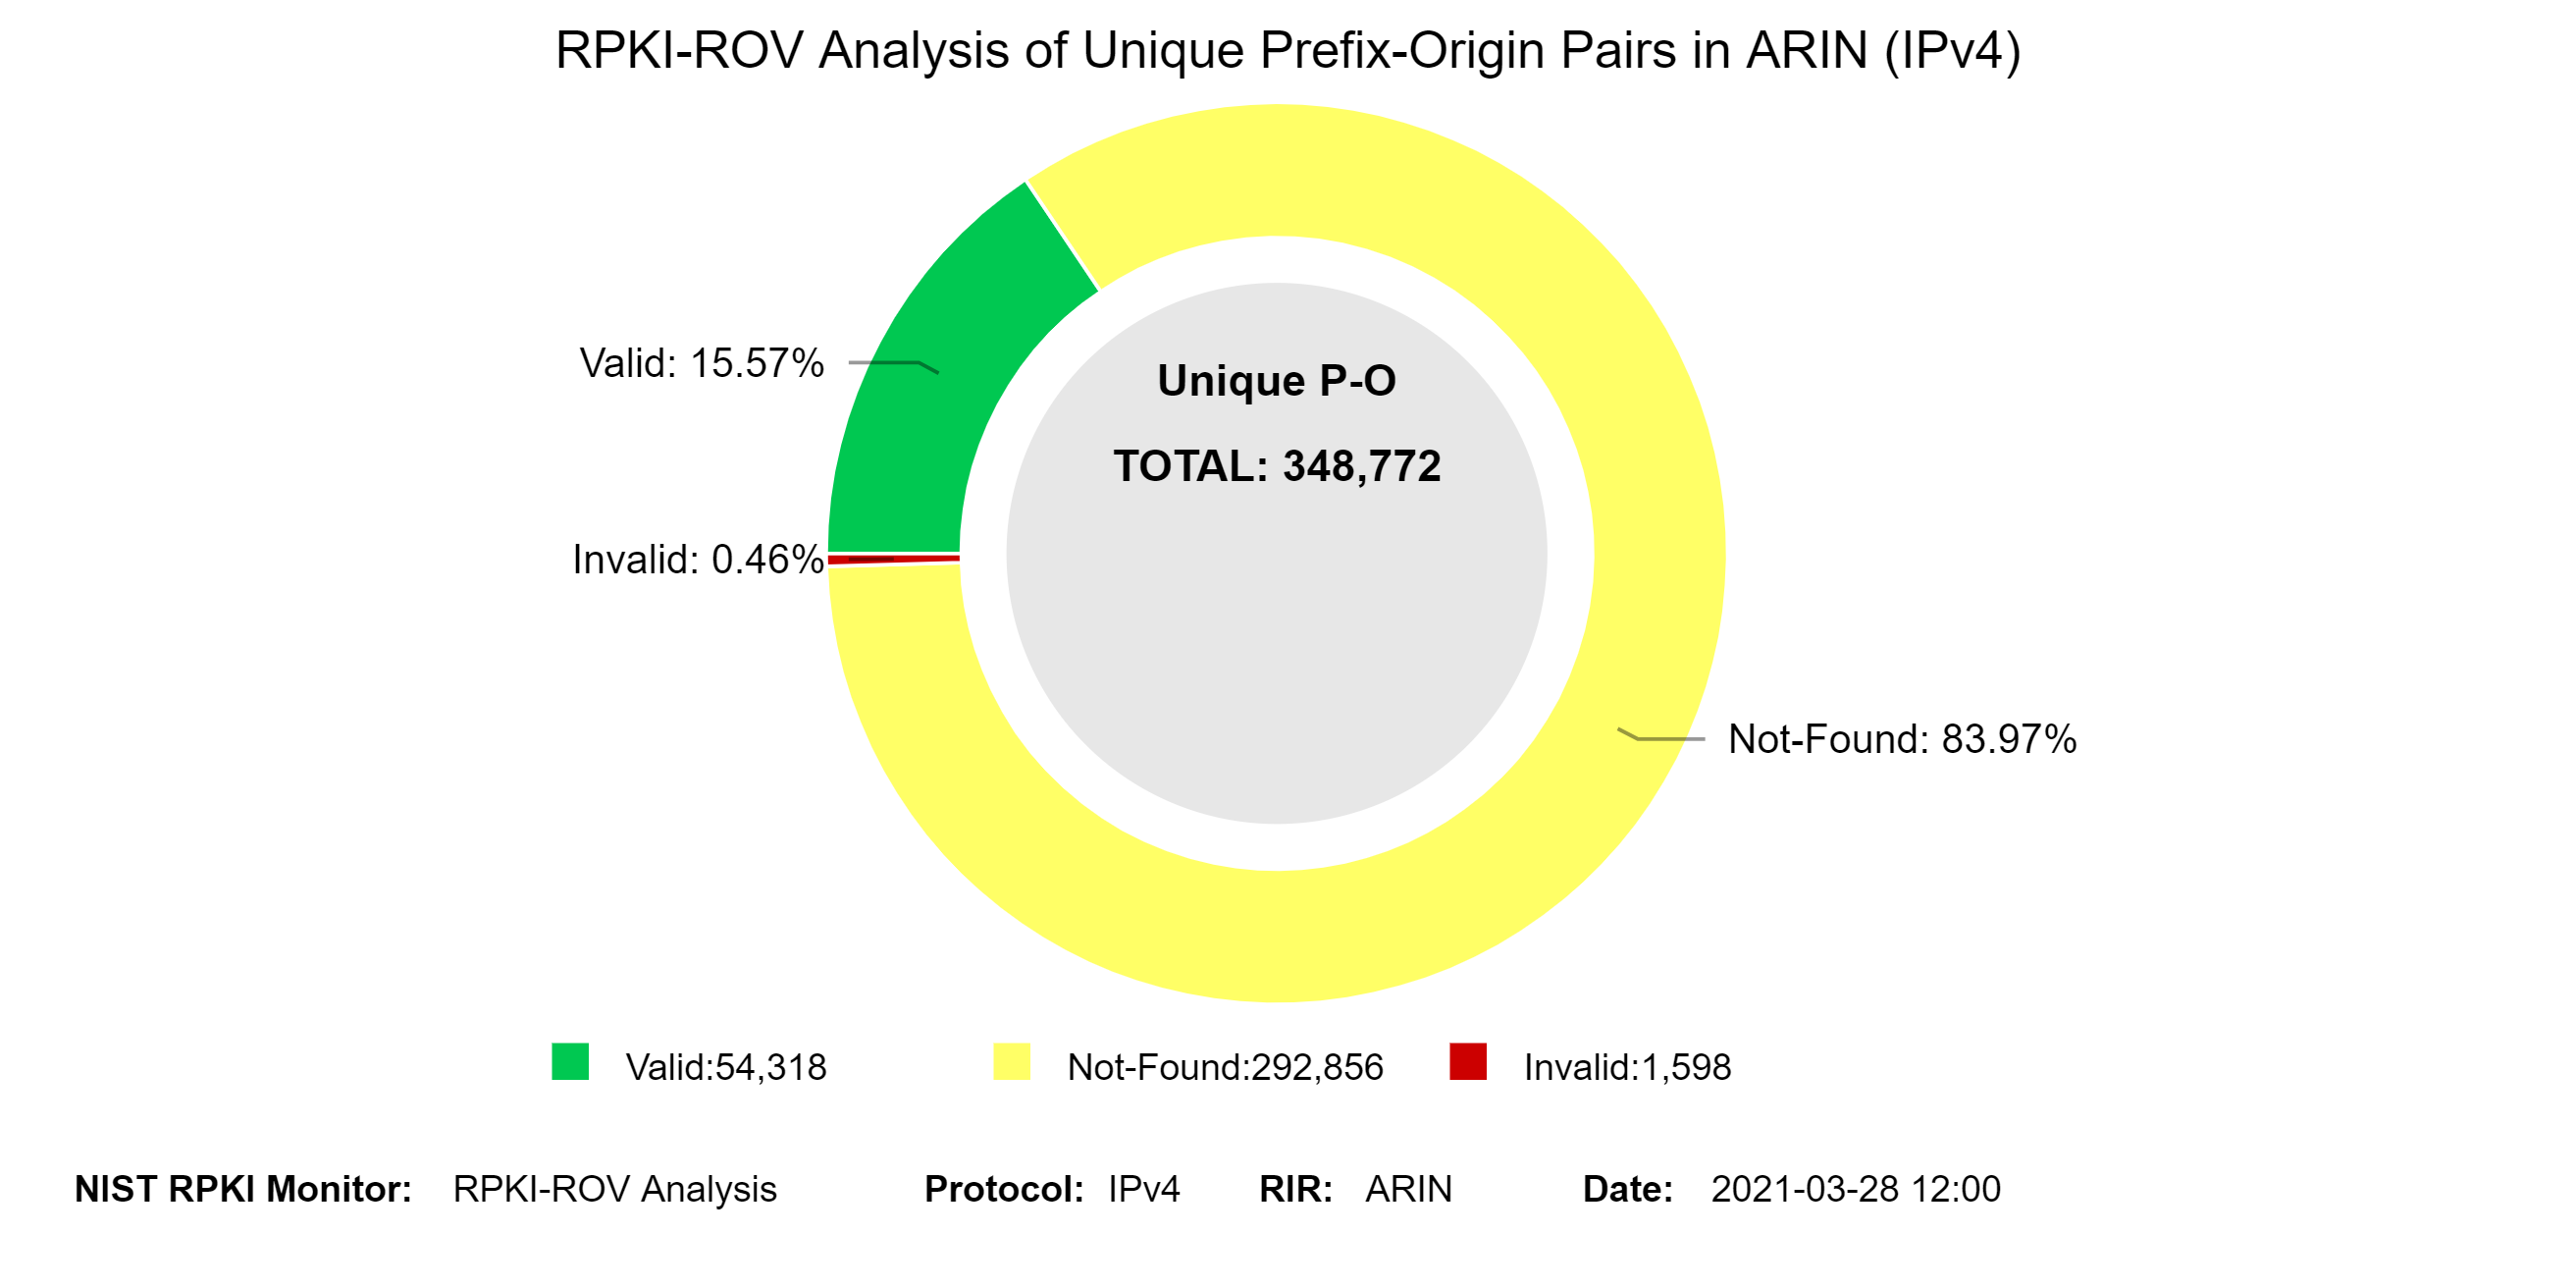
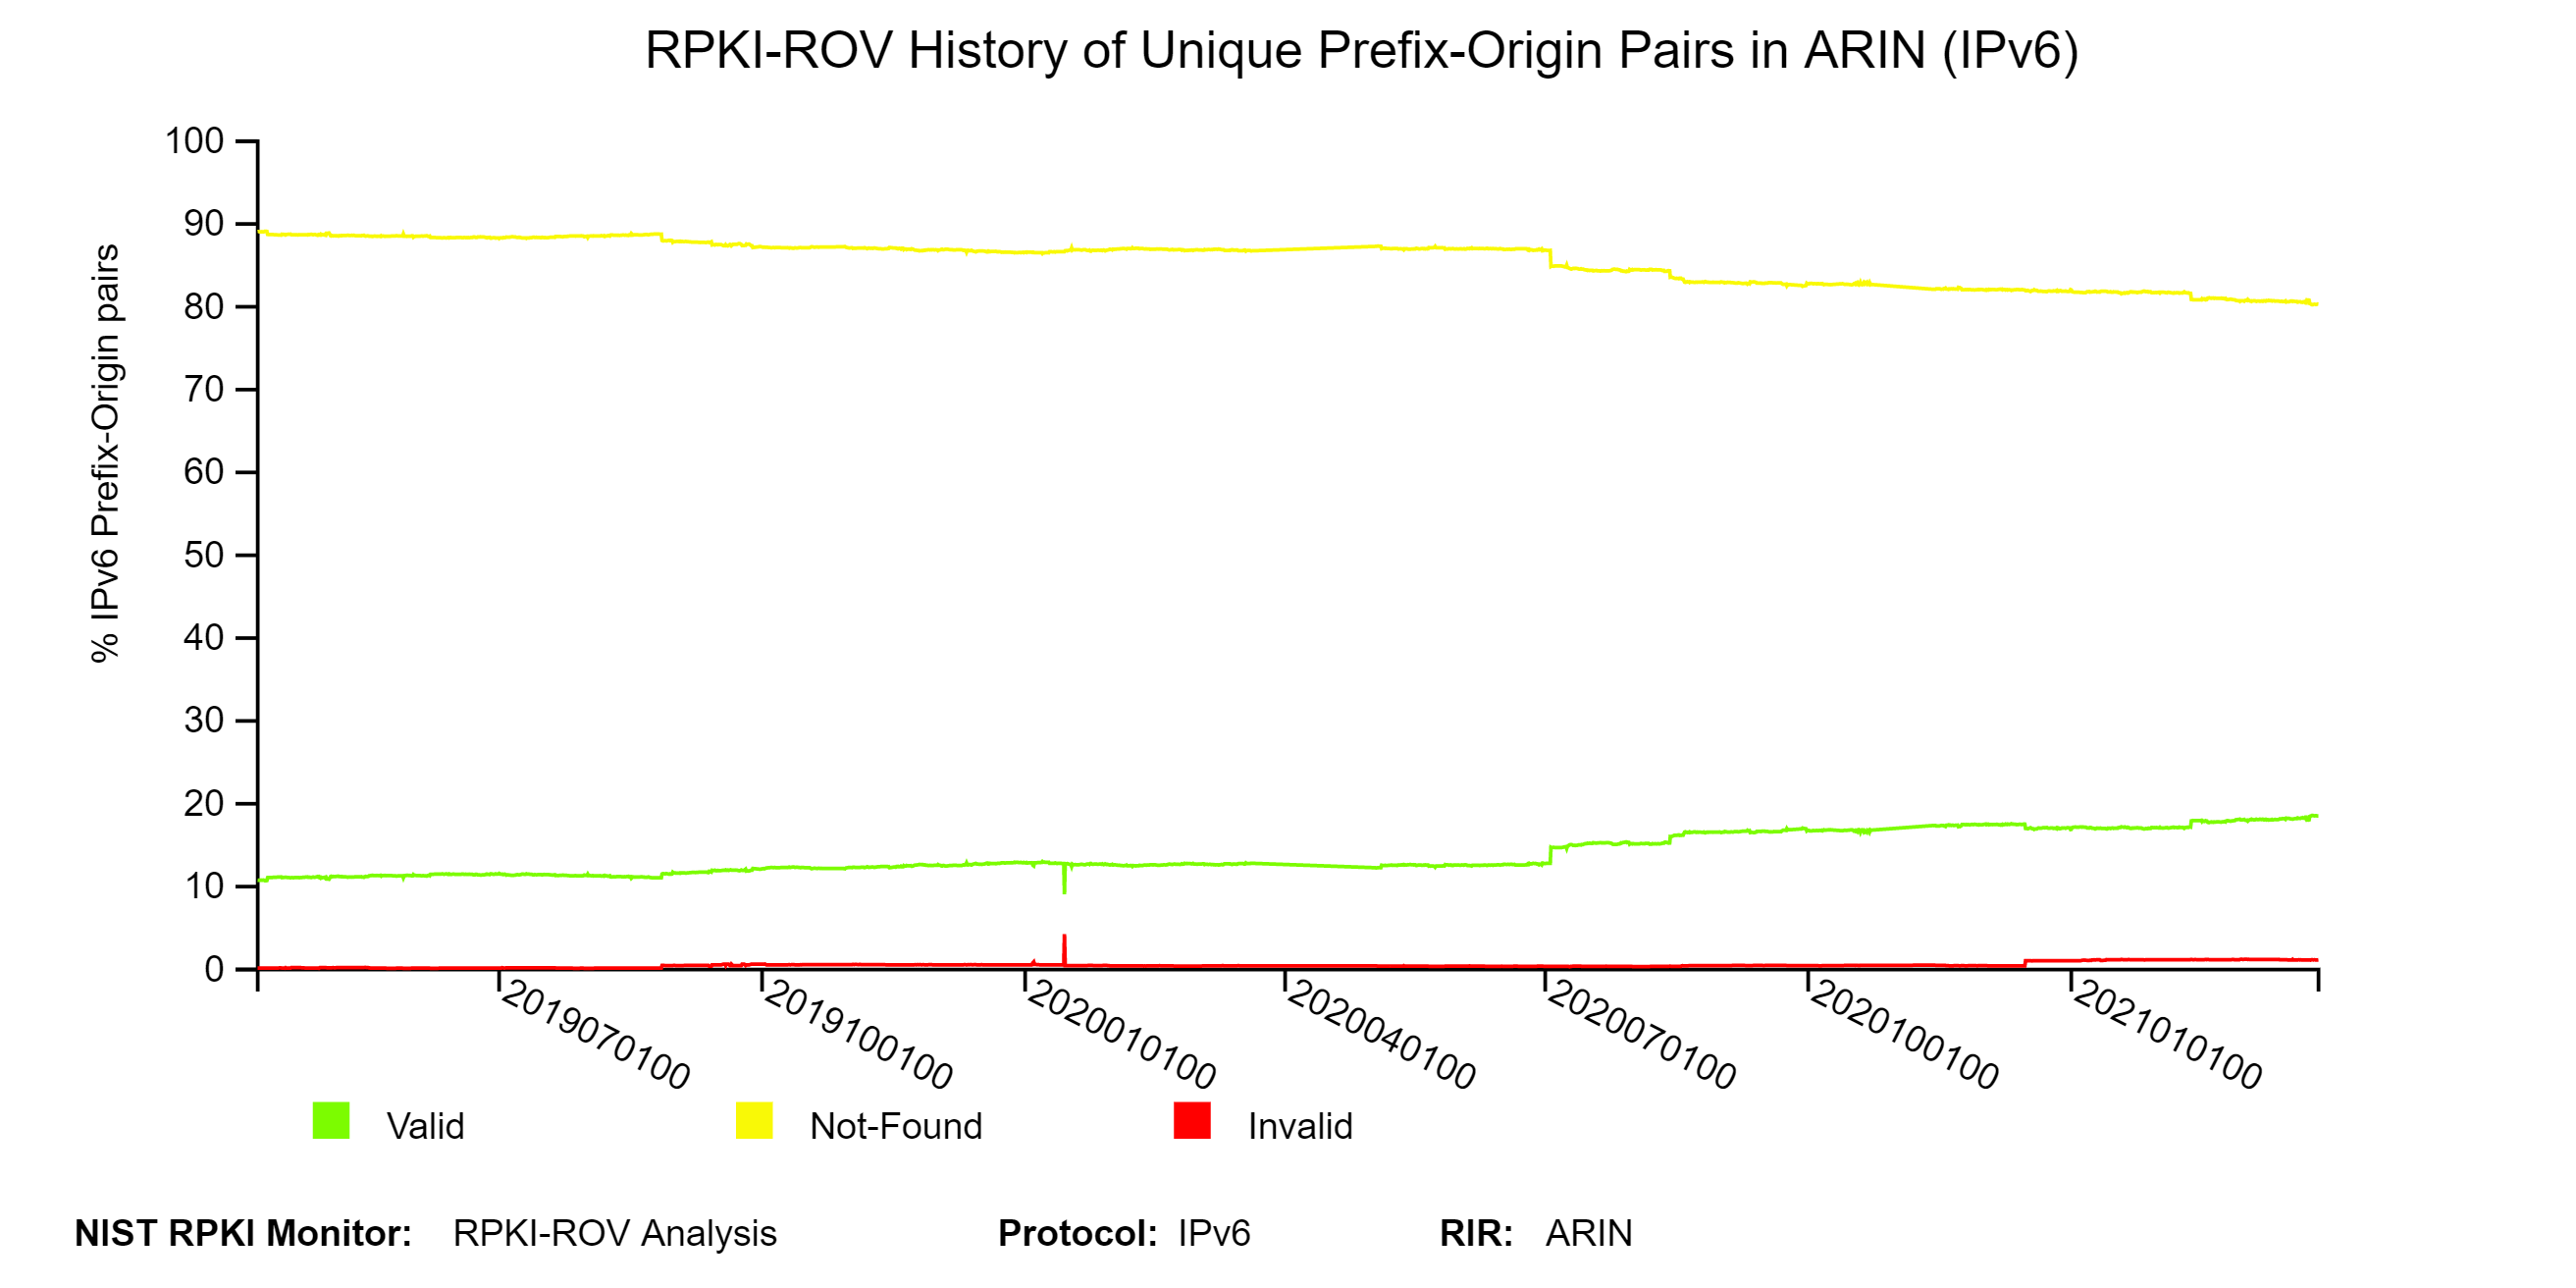
 The two graphs below depict the history of RPKI-ROV analysis results for unique Prefix-Origin pairs in ARIN.
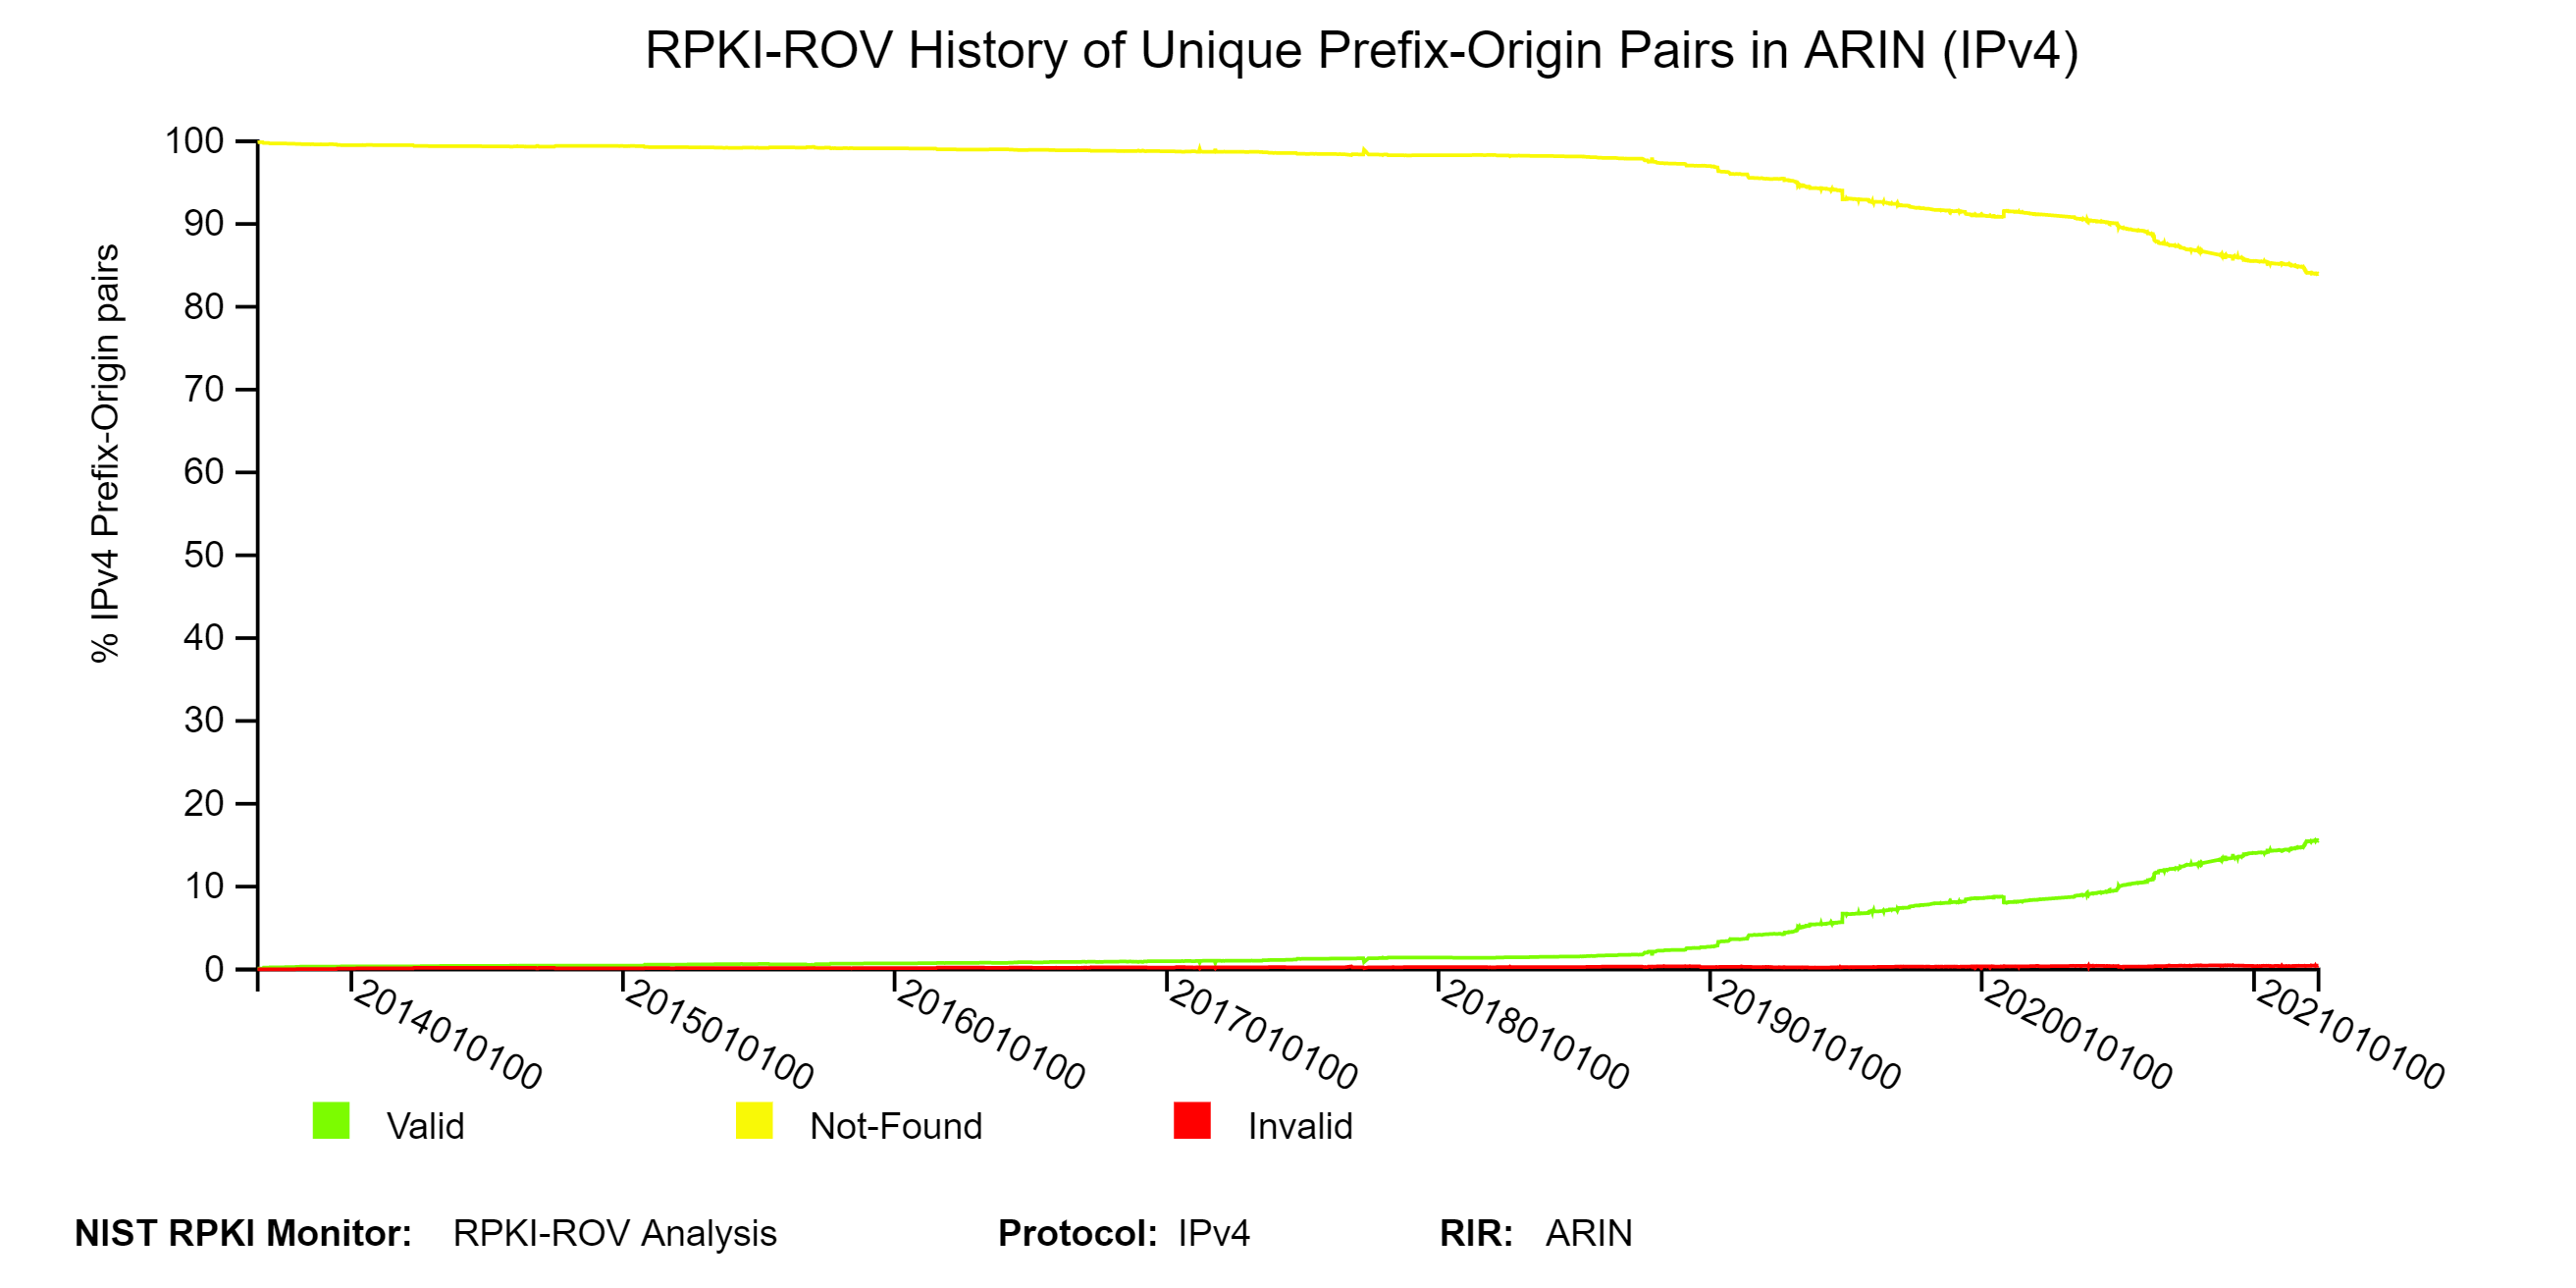
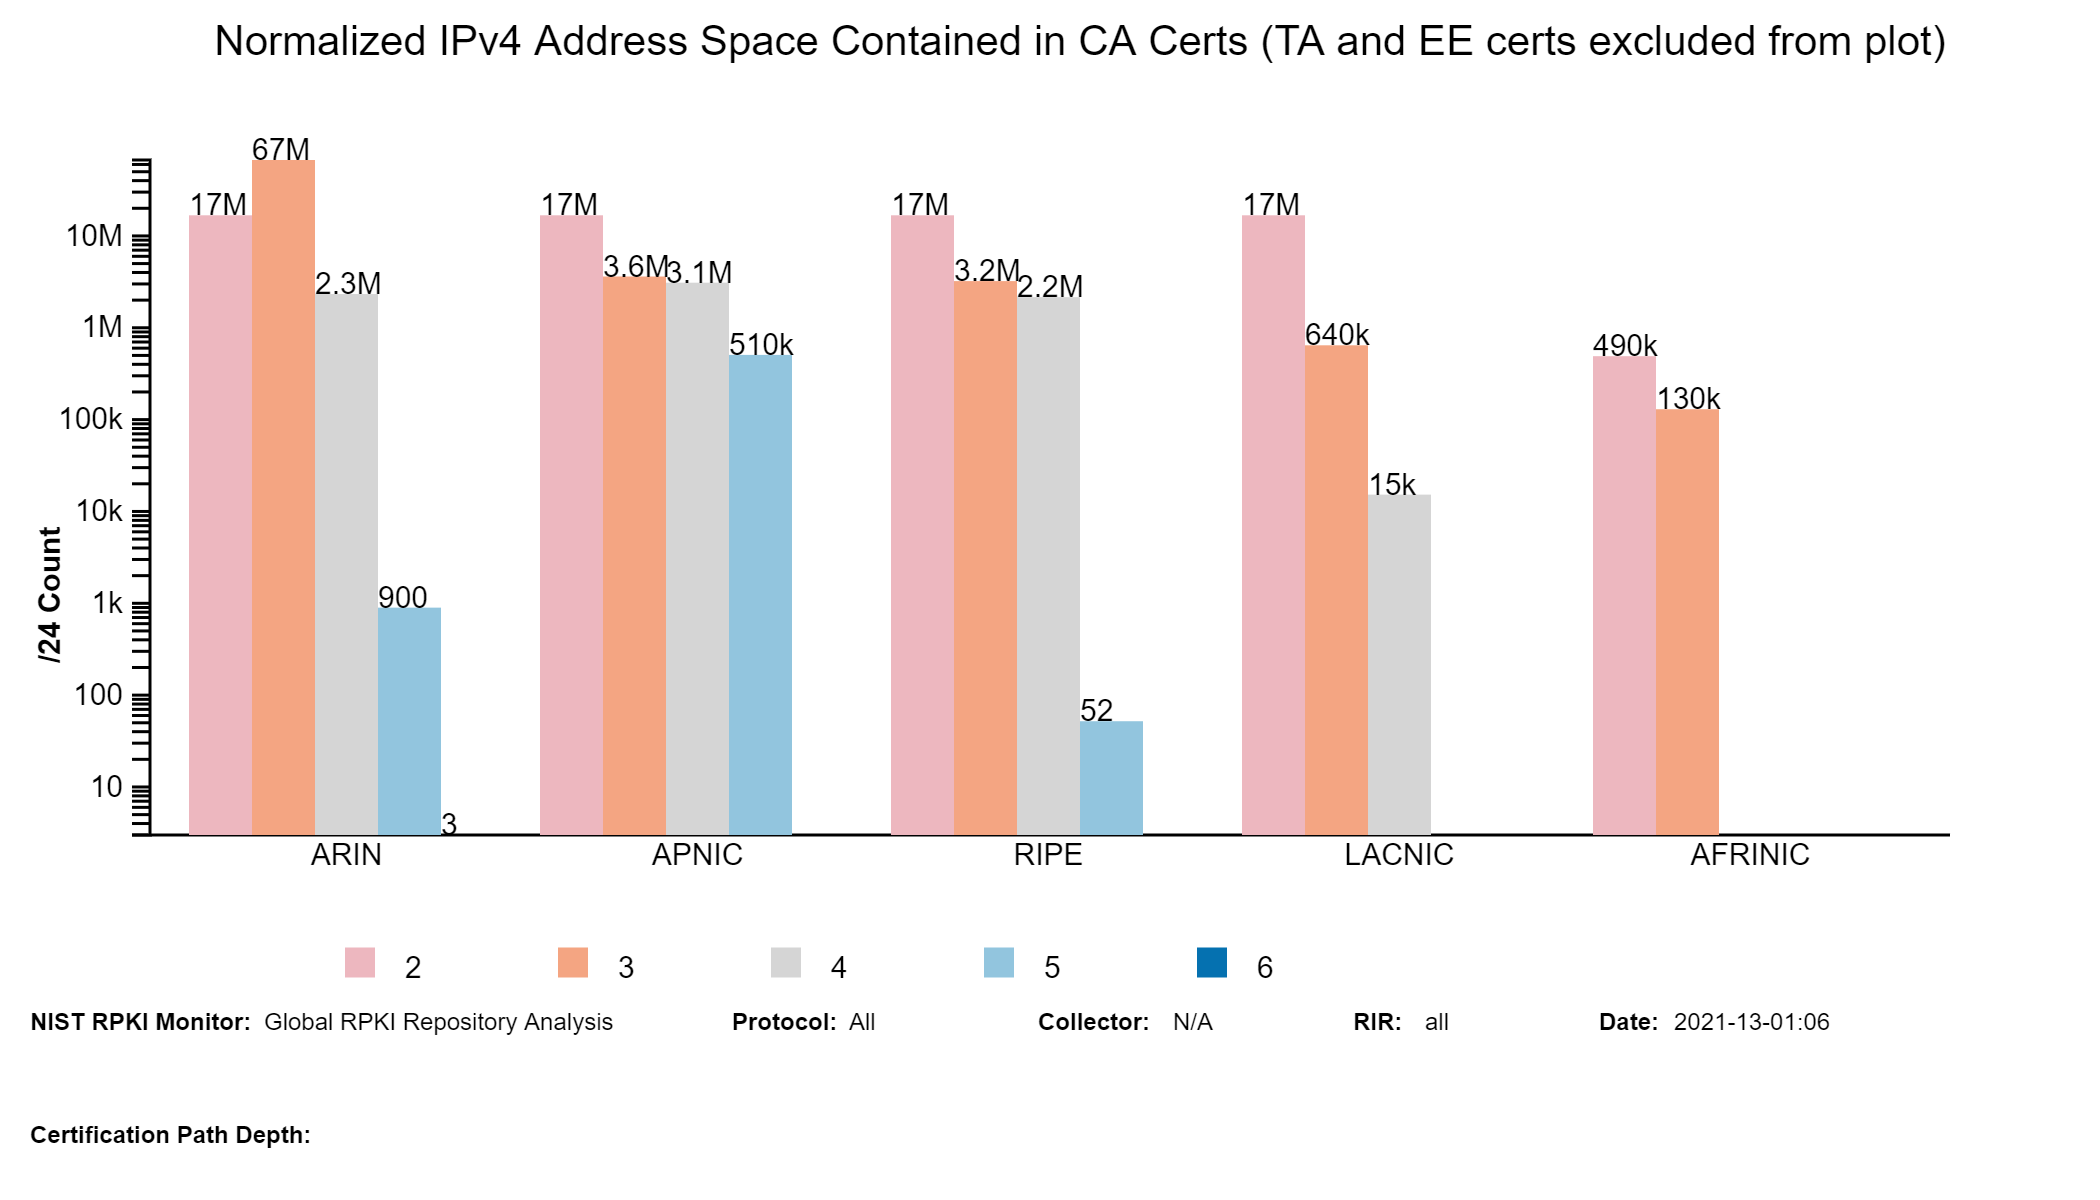
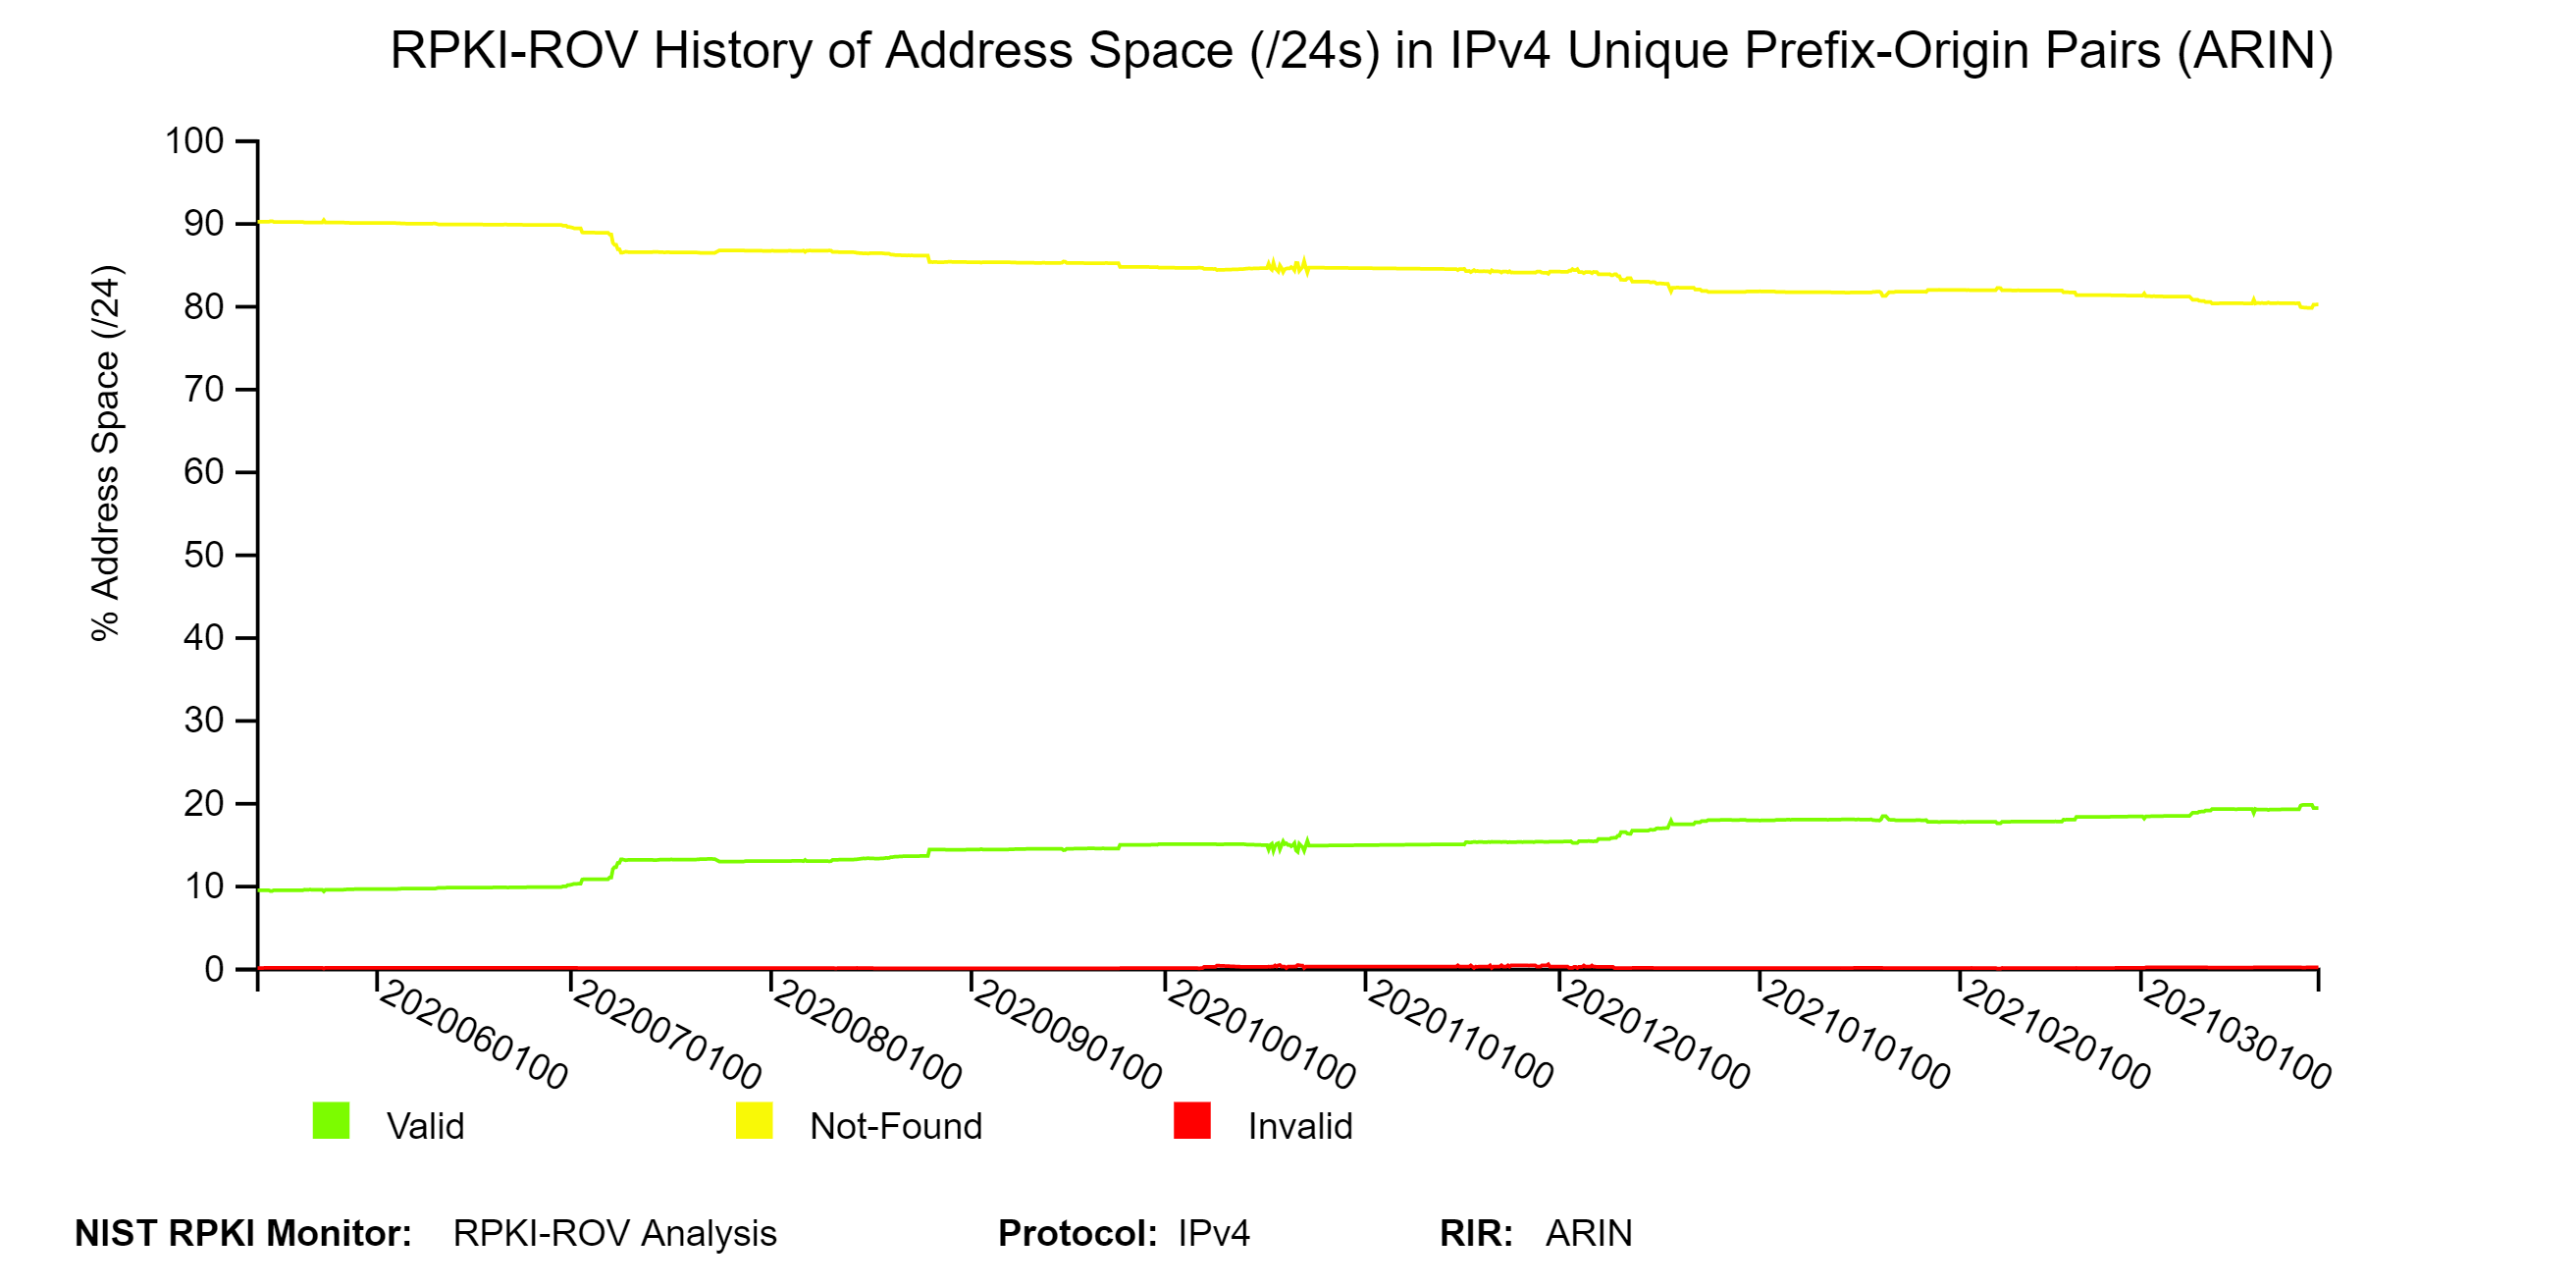
The two graphs below depict a snapshot of RPKI-ROV analysis and its history for address space (/24 equivalents) contained in IPv4 prefixes in ARIN.
RPKI-ROV Analysis: Valid Originations
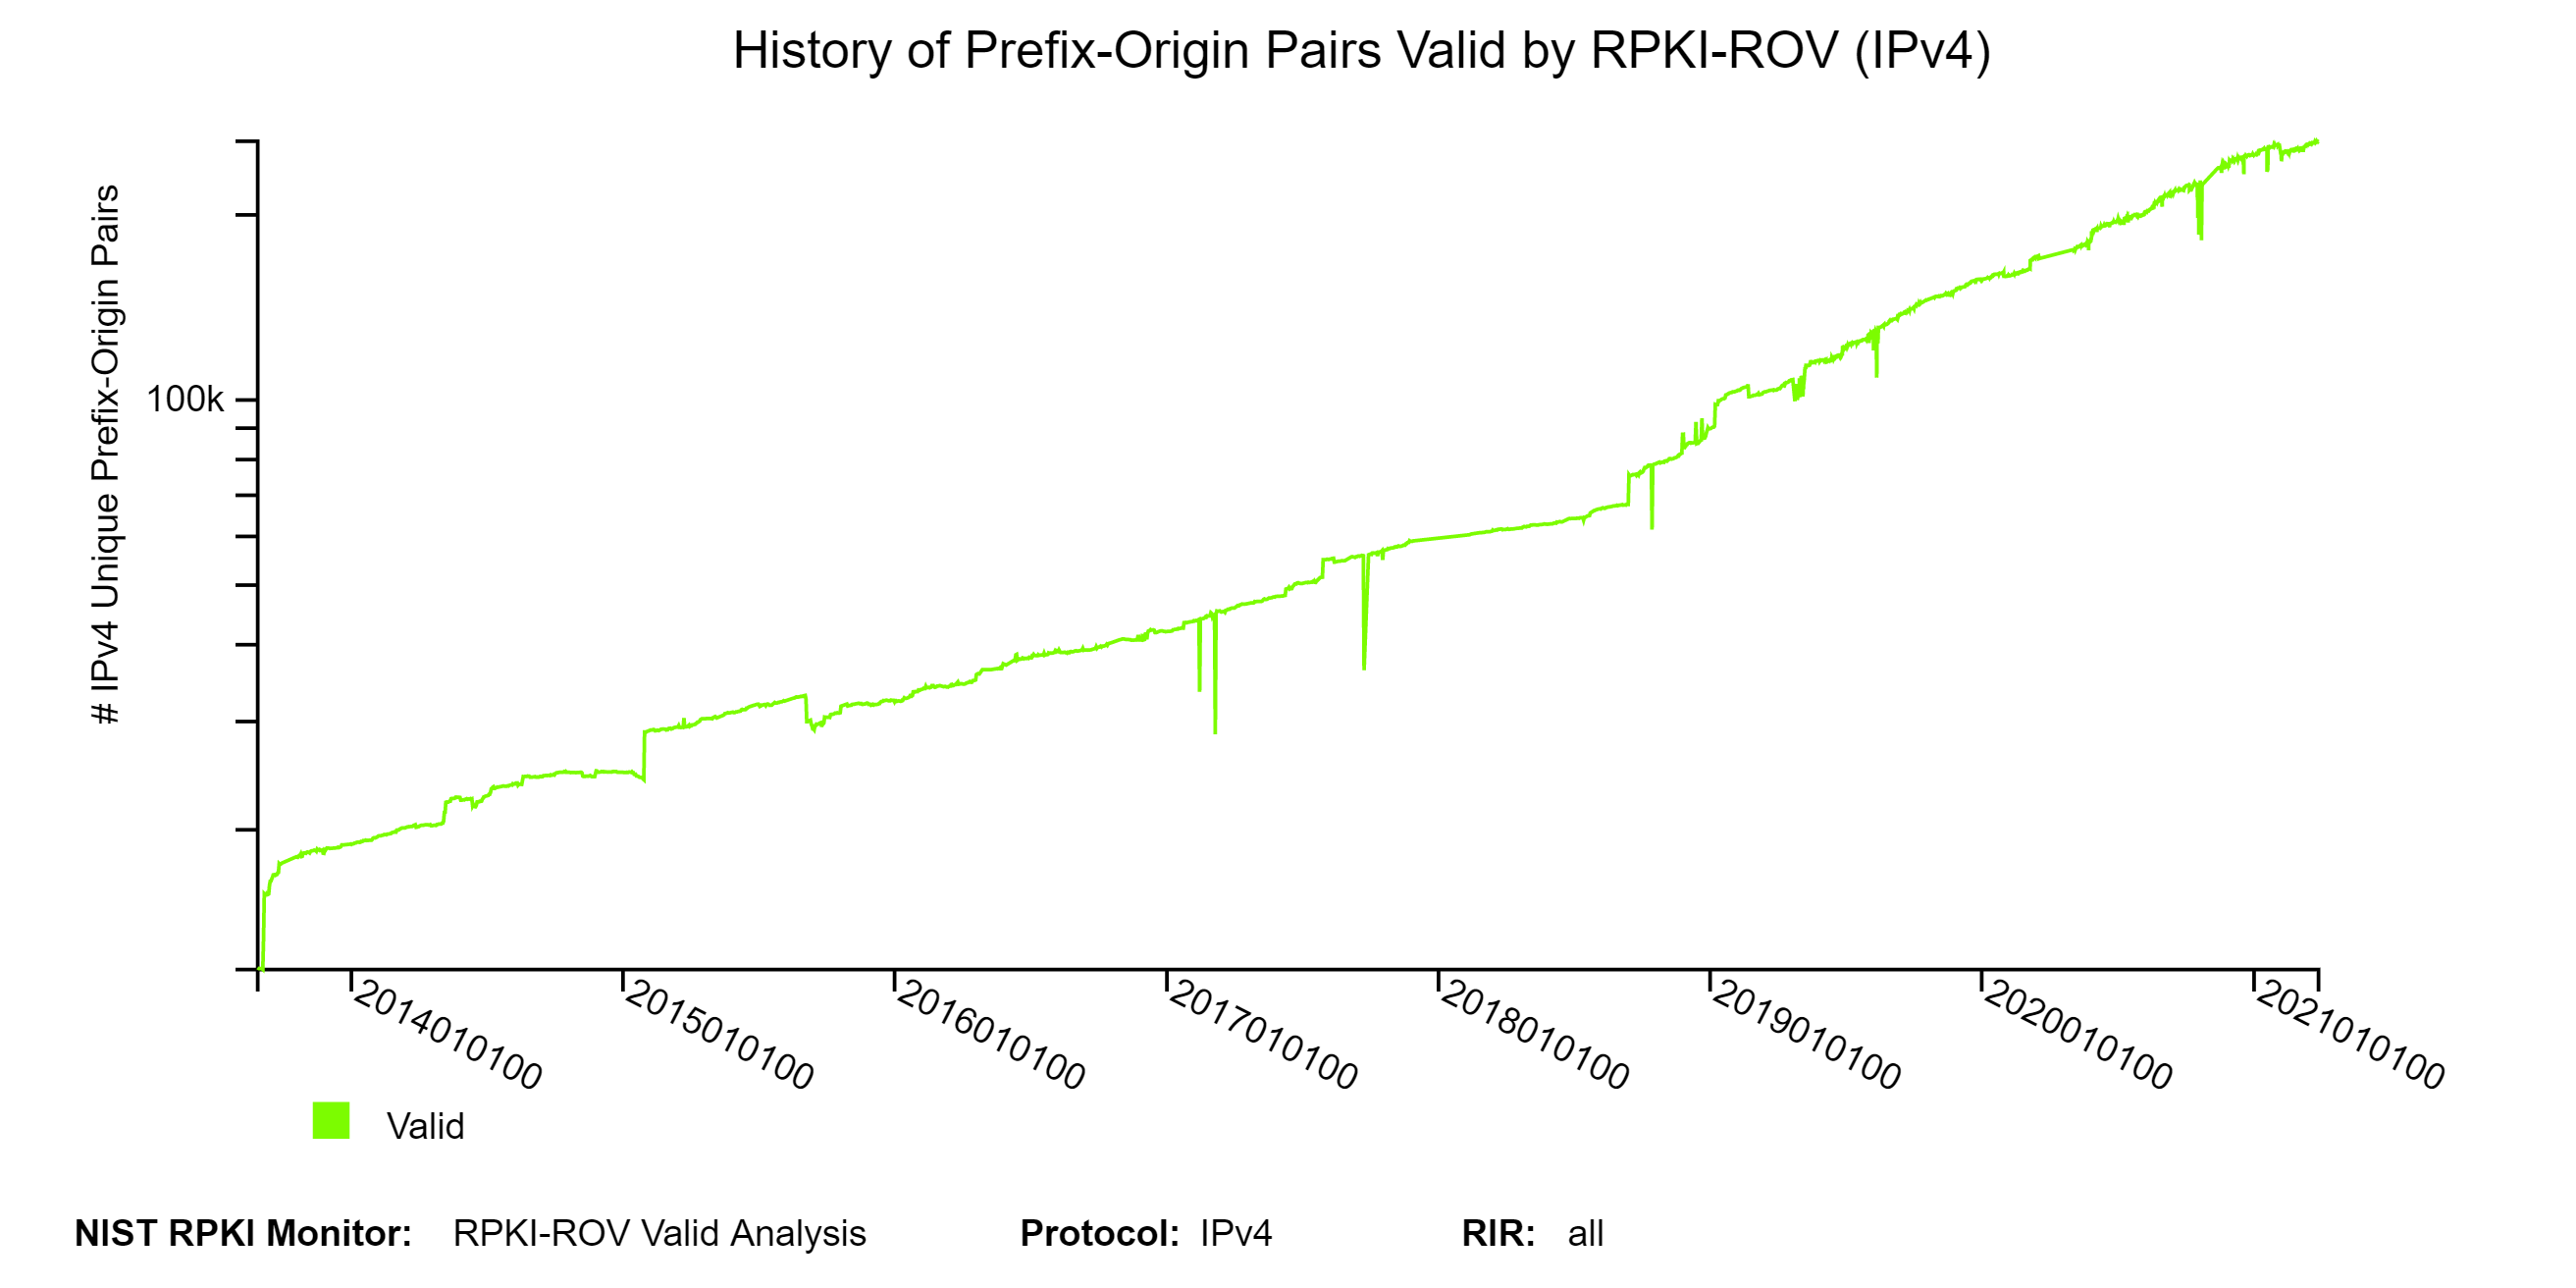
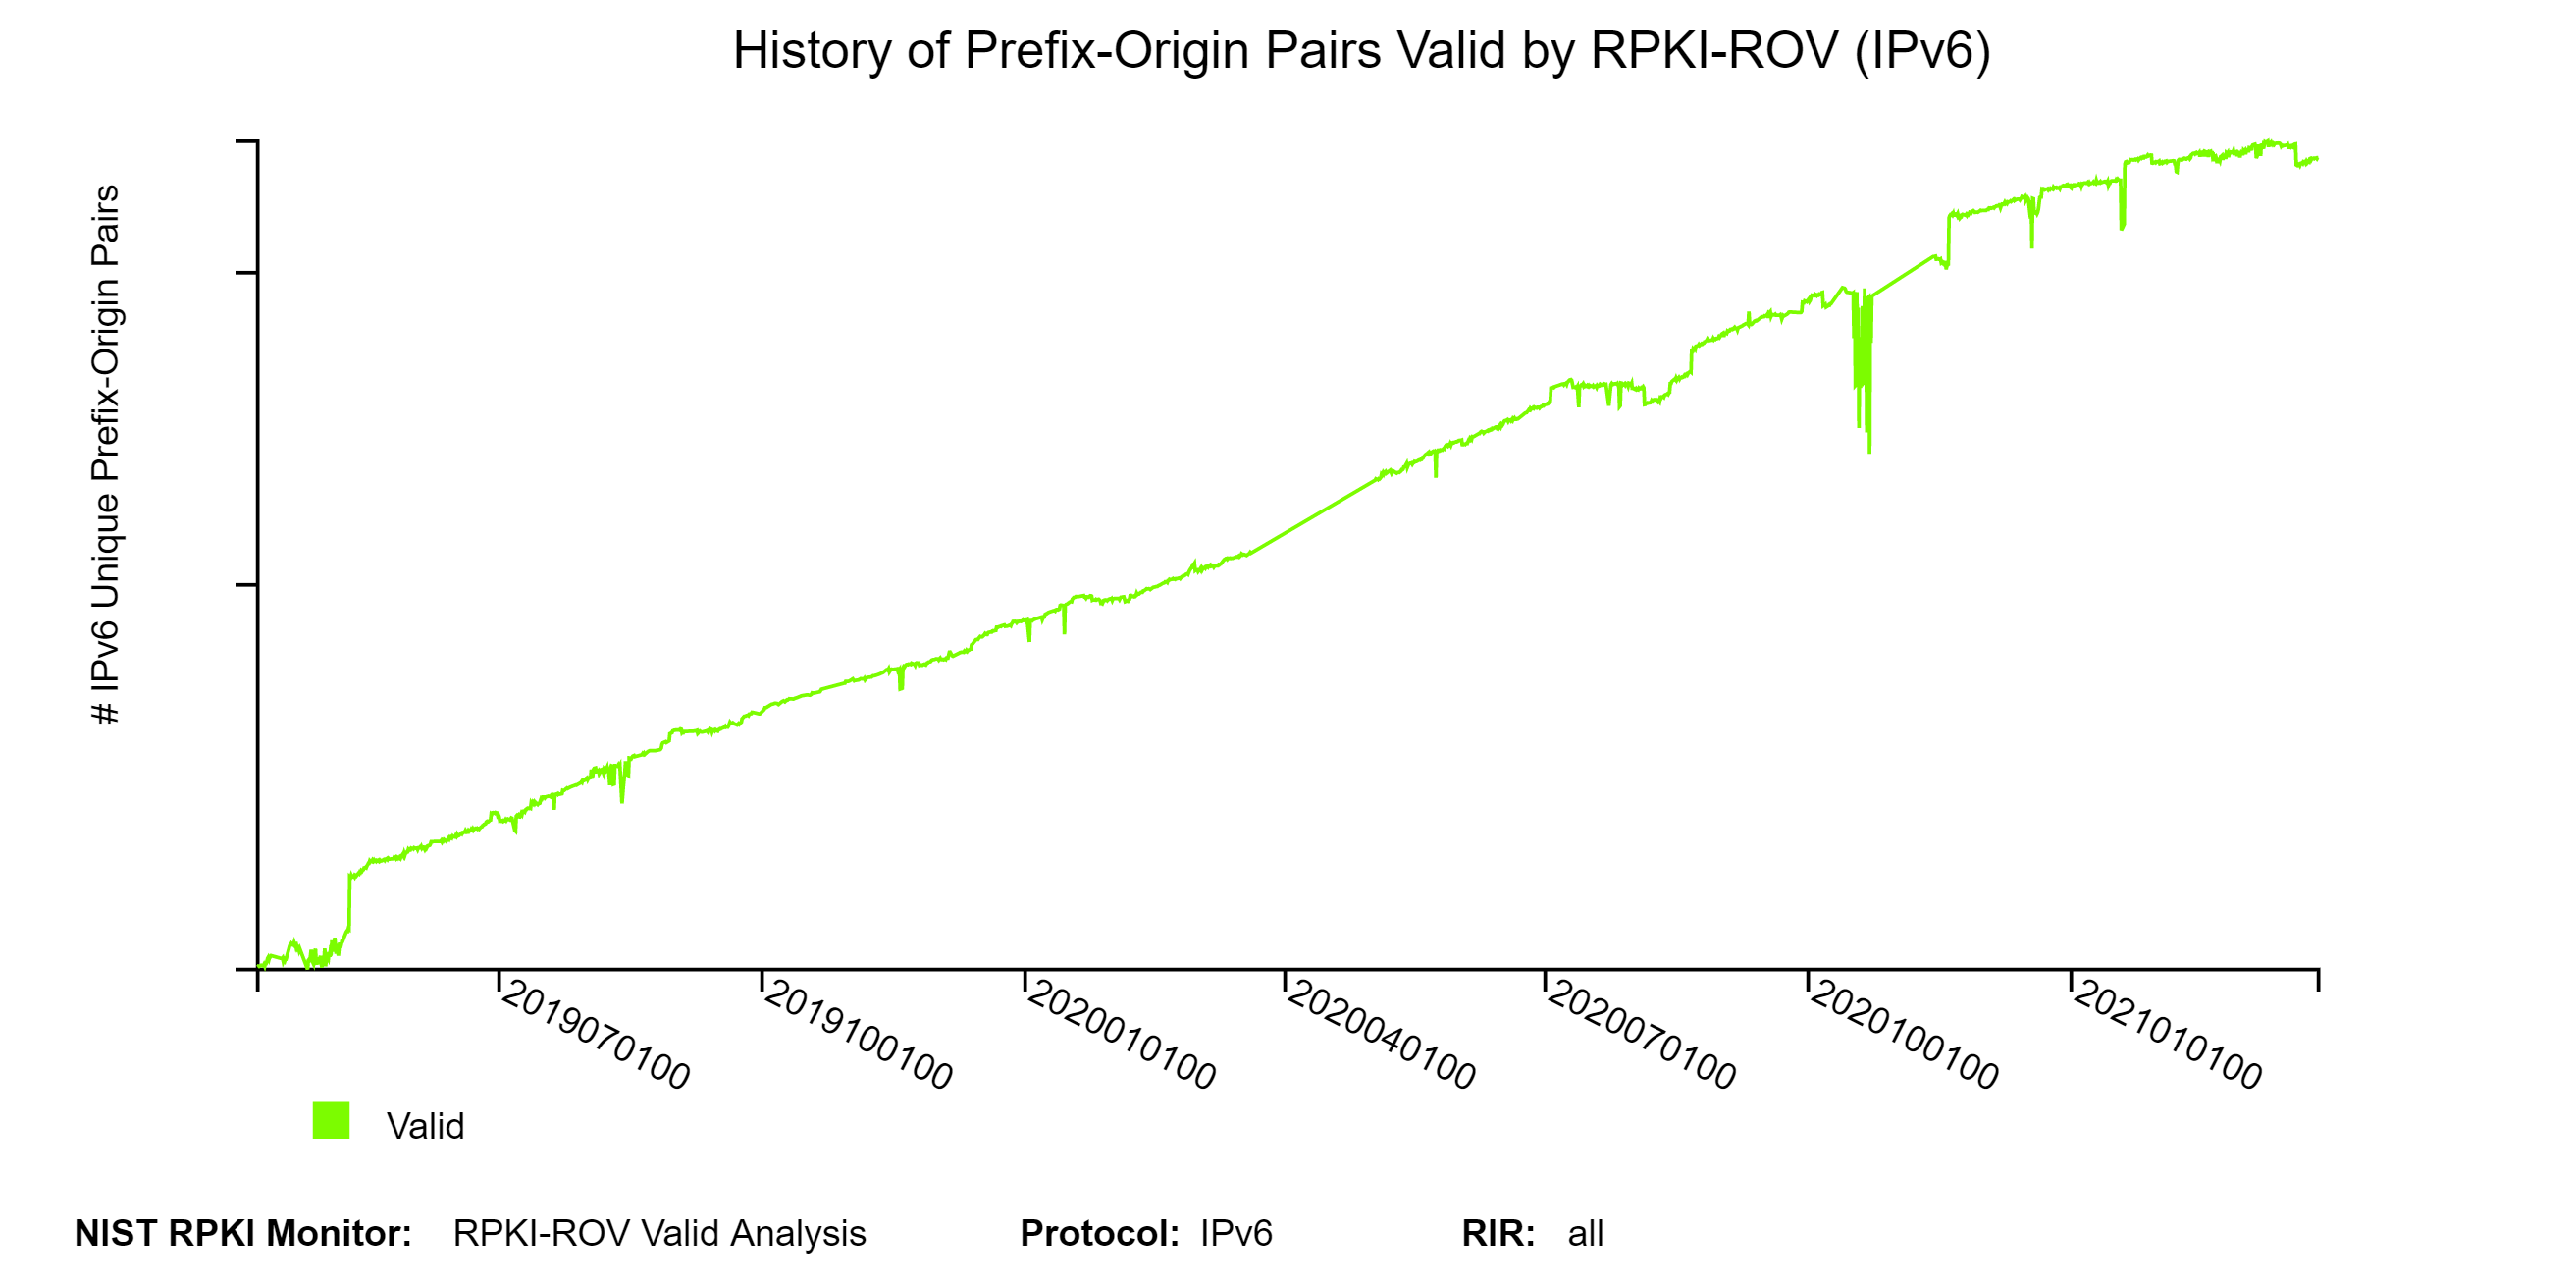
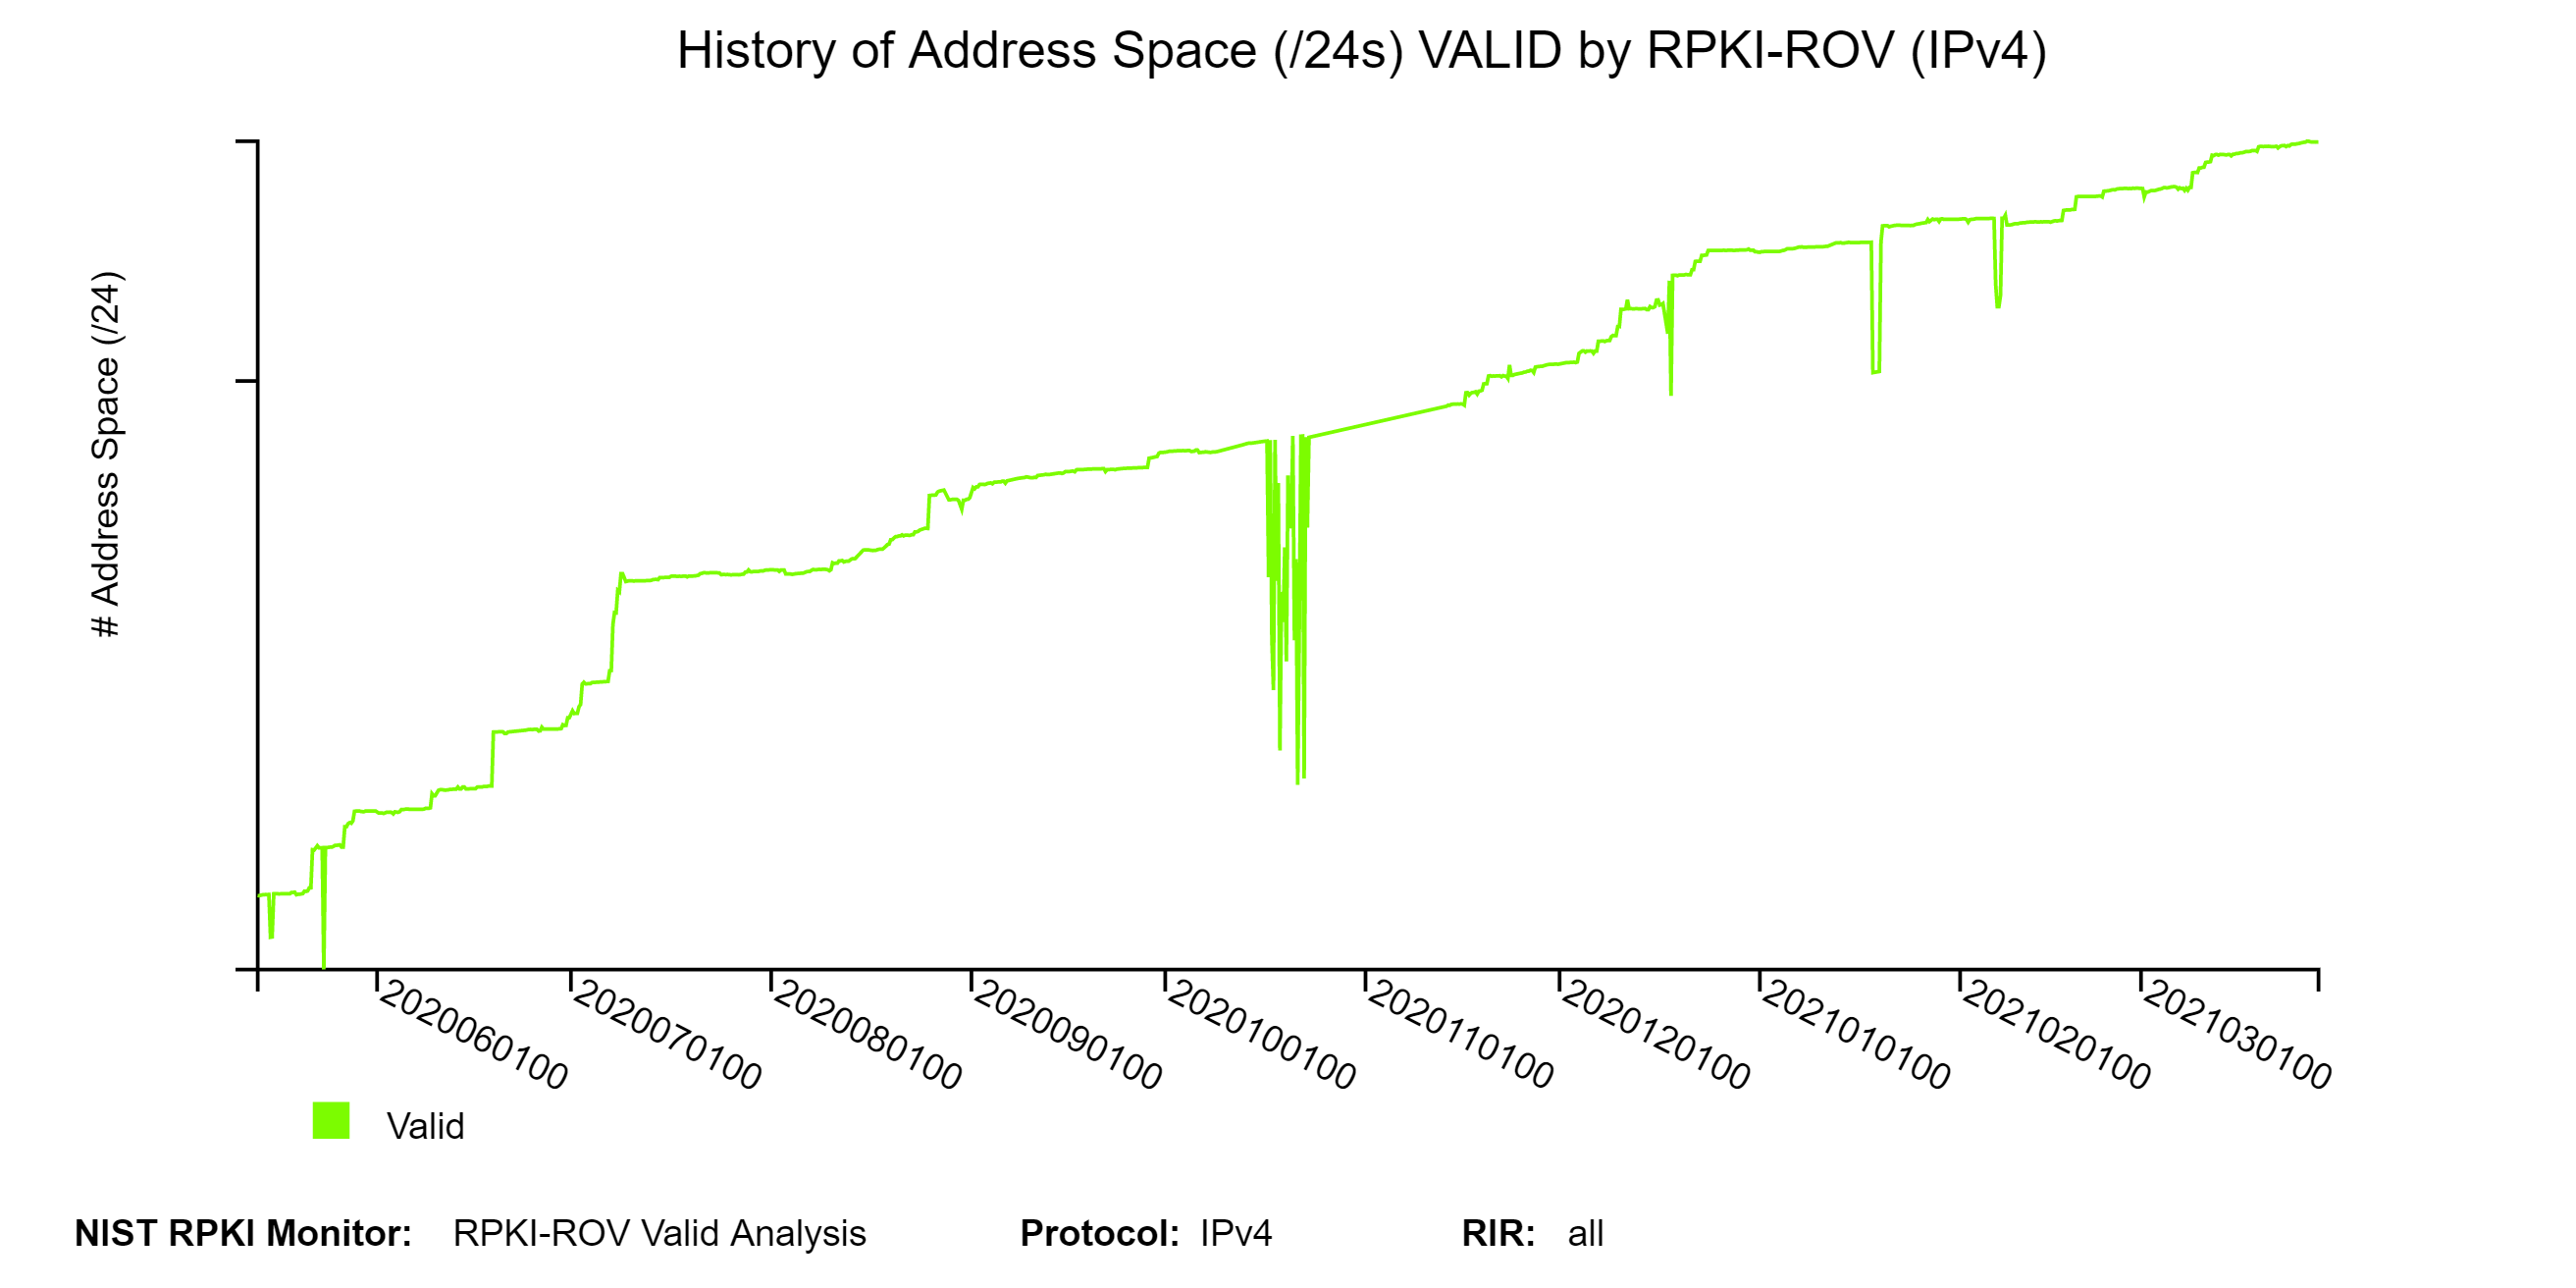
To get a detailed view of Prefix-Origin pairs that are Valid by RPKI-ROV, we provide a set of analyses along the dimensions of the top 25 organizations, prefix length, and AS path length. The following three figures depict the history of Valid Prefix-Origin pairs and the corresponding Valid address space (/24 equivalents). The Valid address space history plot is provided only for IPv4 (jump to this analysis).
The two graphs below depict the top 25 Autonomous Systems (ASes) with the most BGP observed IPv4 prefixes Valid by RPKI-ROV and the top 25 ASes with the most IPv4 Address Space (/24s) VALID by RPKI-ROV. The organization names of the ASes are shown on the y-axis next to the AS numbers (ASNs). Similar graphs are also available for IPv6 in the Monitor (jump to this analysis).
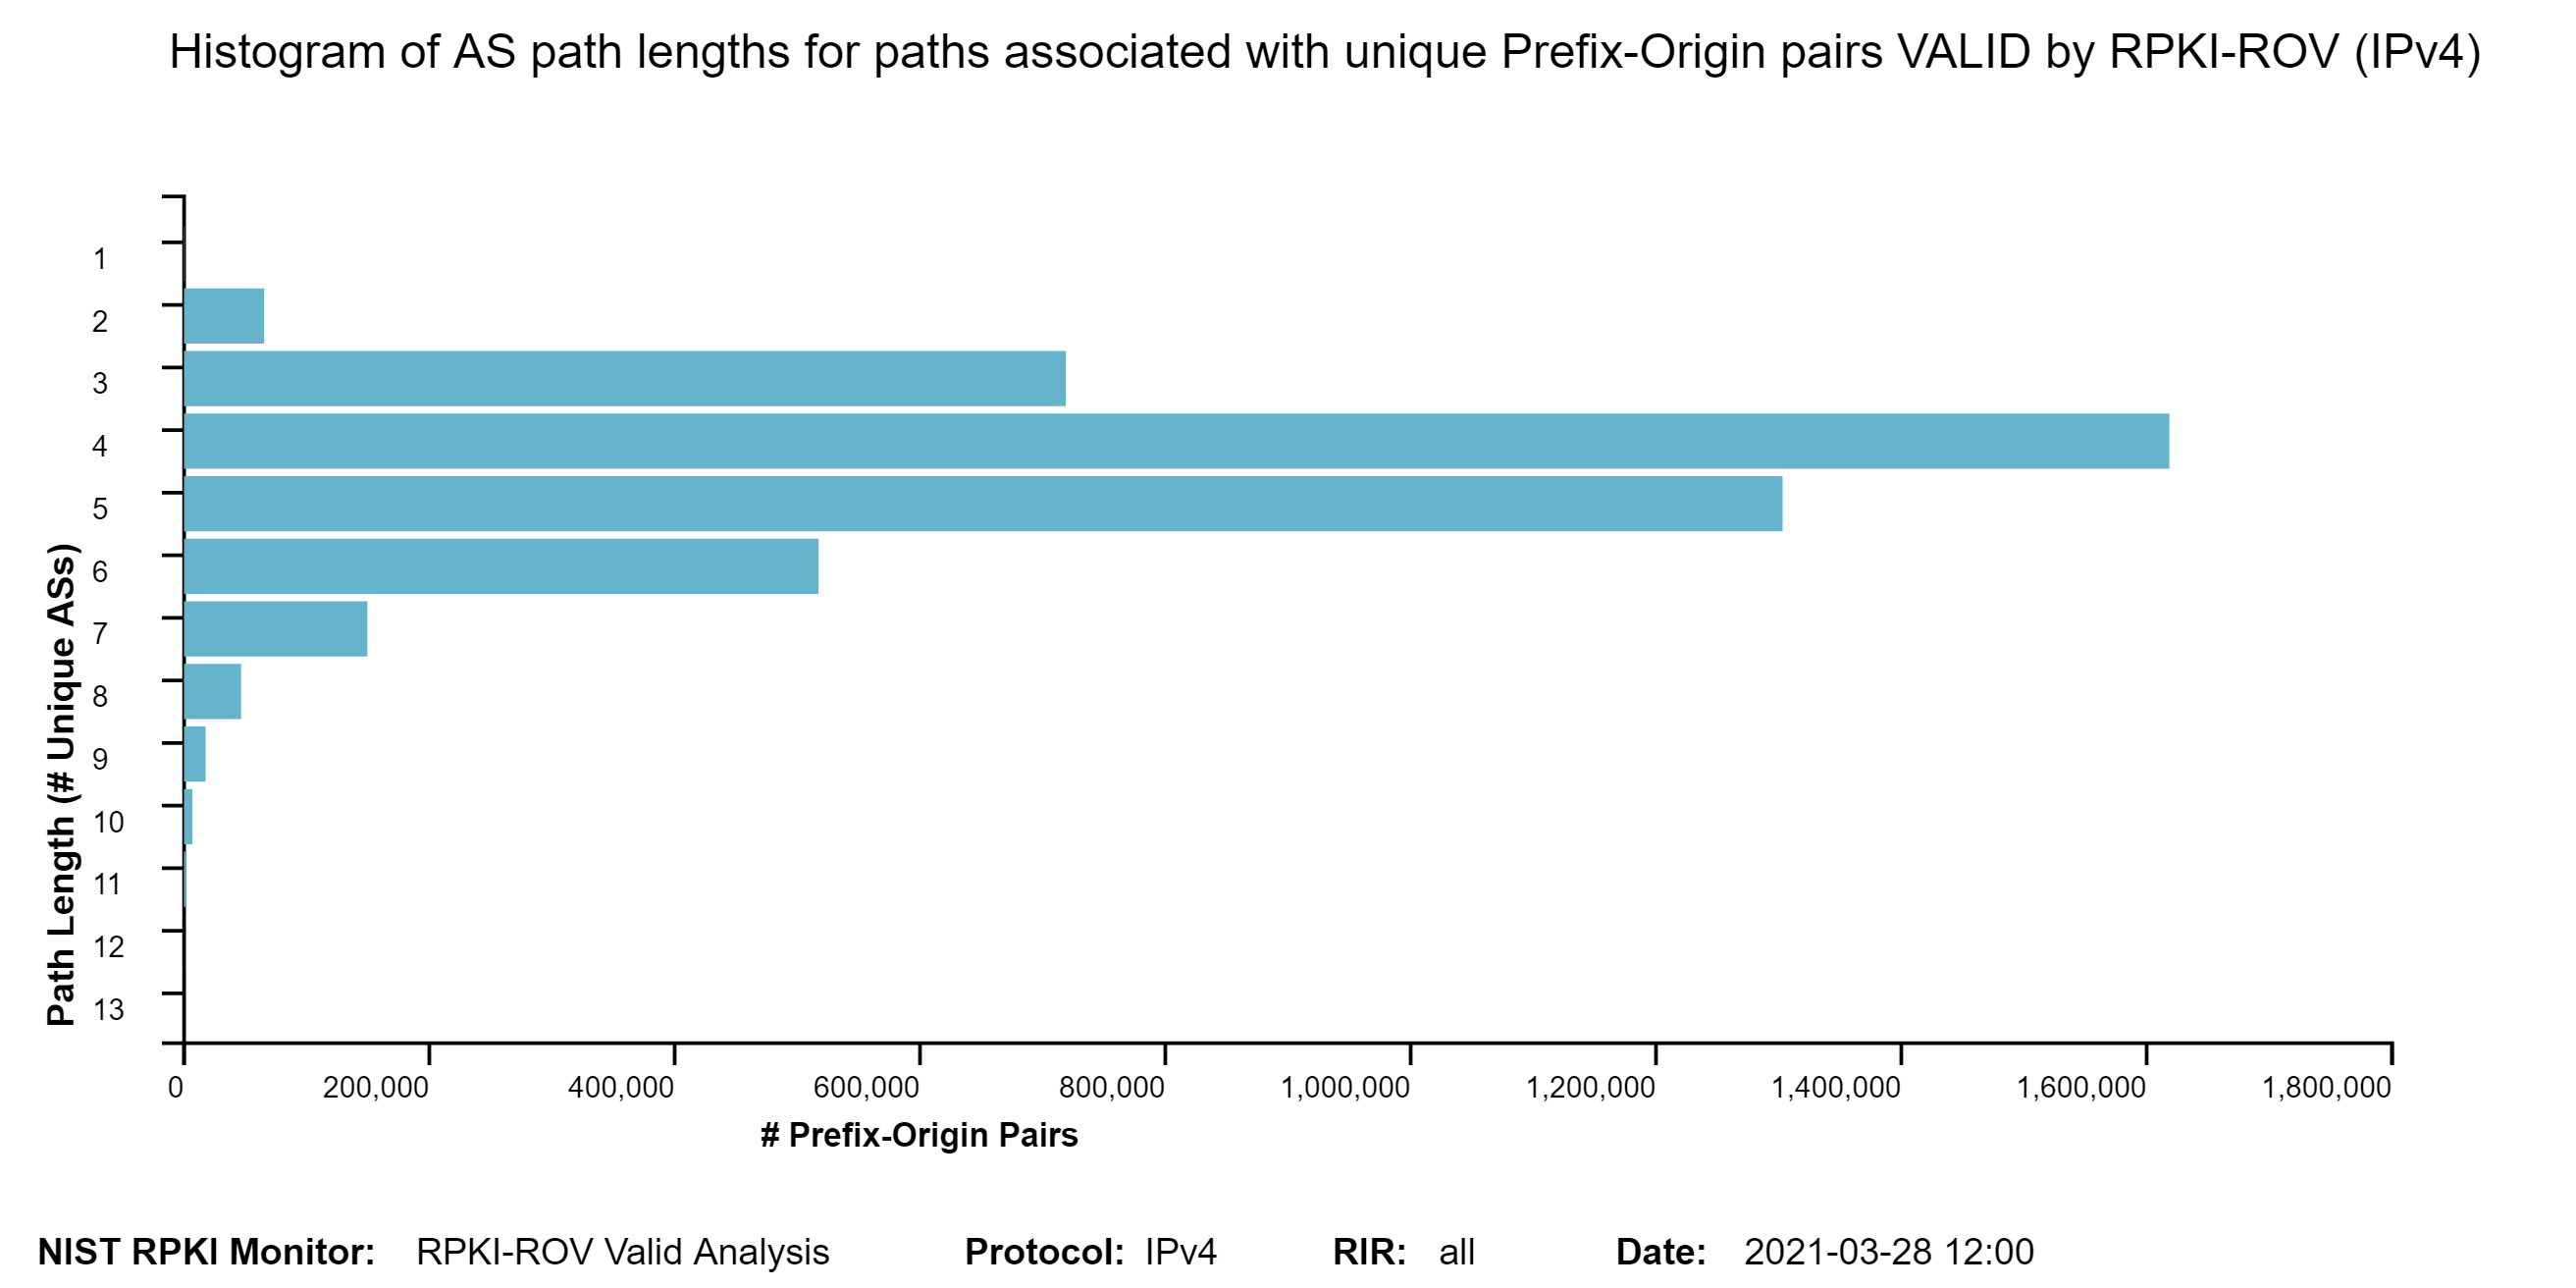
The two graphs below show: (1) the histogram of prefix lengths in unique Prefix-Origin pairs that are Valid by RPKI-ROV (IPv4), and (2) the histogram of AS path lengths for the paths associated with unique Prefix-Origin pairs that are Valid by RPKI-ROV (IPv4). The AS path length is measured as the number of unique ASes in the path. The vertical axis represents the prefix length and the AS path length in the two figures, respectively. The horizontal axis represents the number of unique Prefix-Origin pairs. Similar graphs are also available for IPv6 in the Monitor (jump to this analysis). 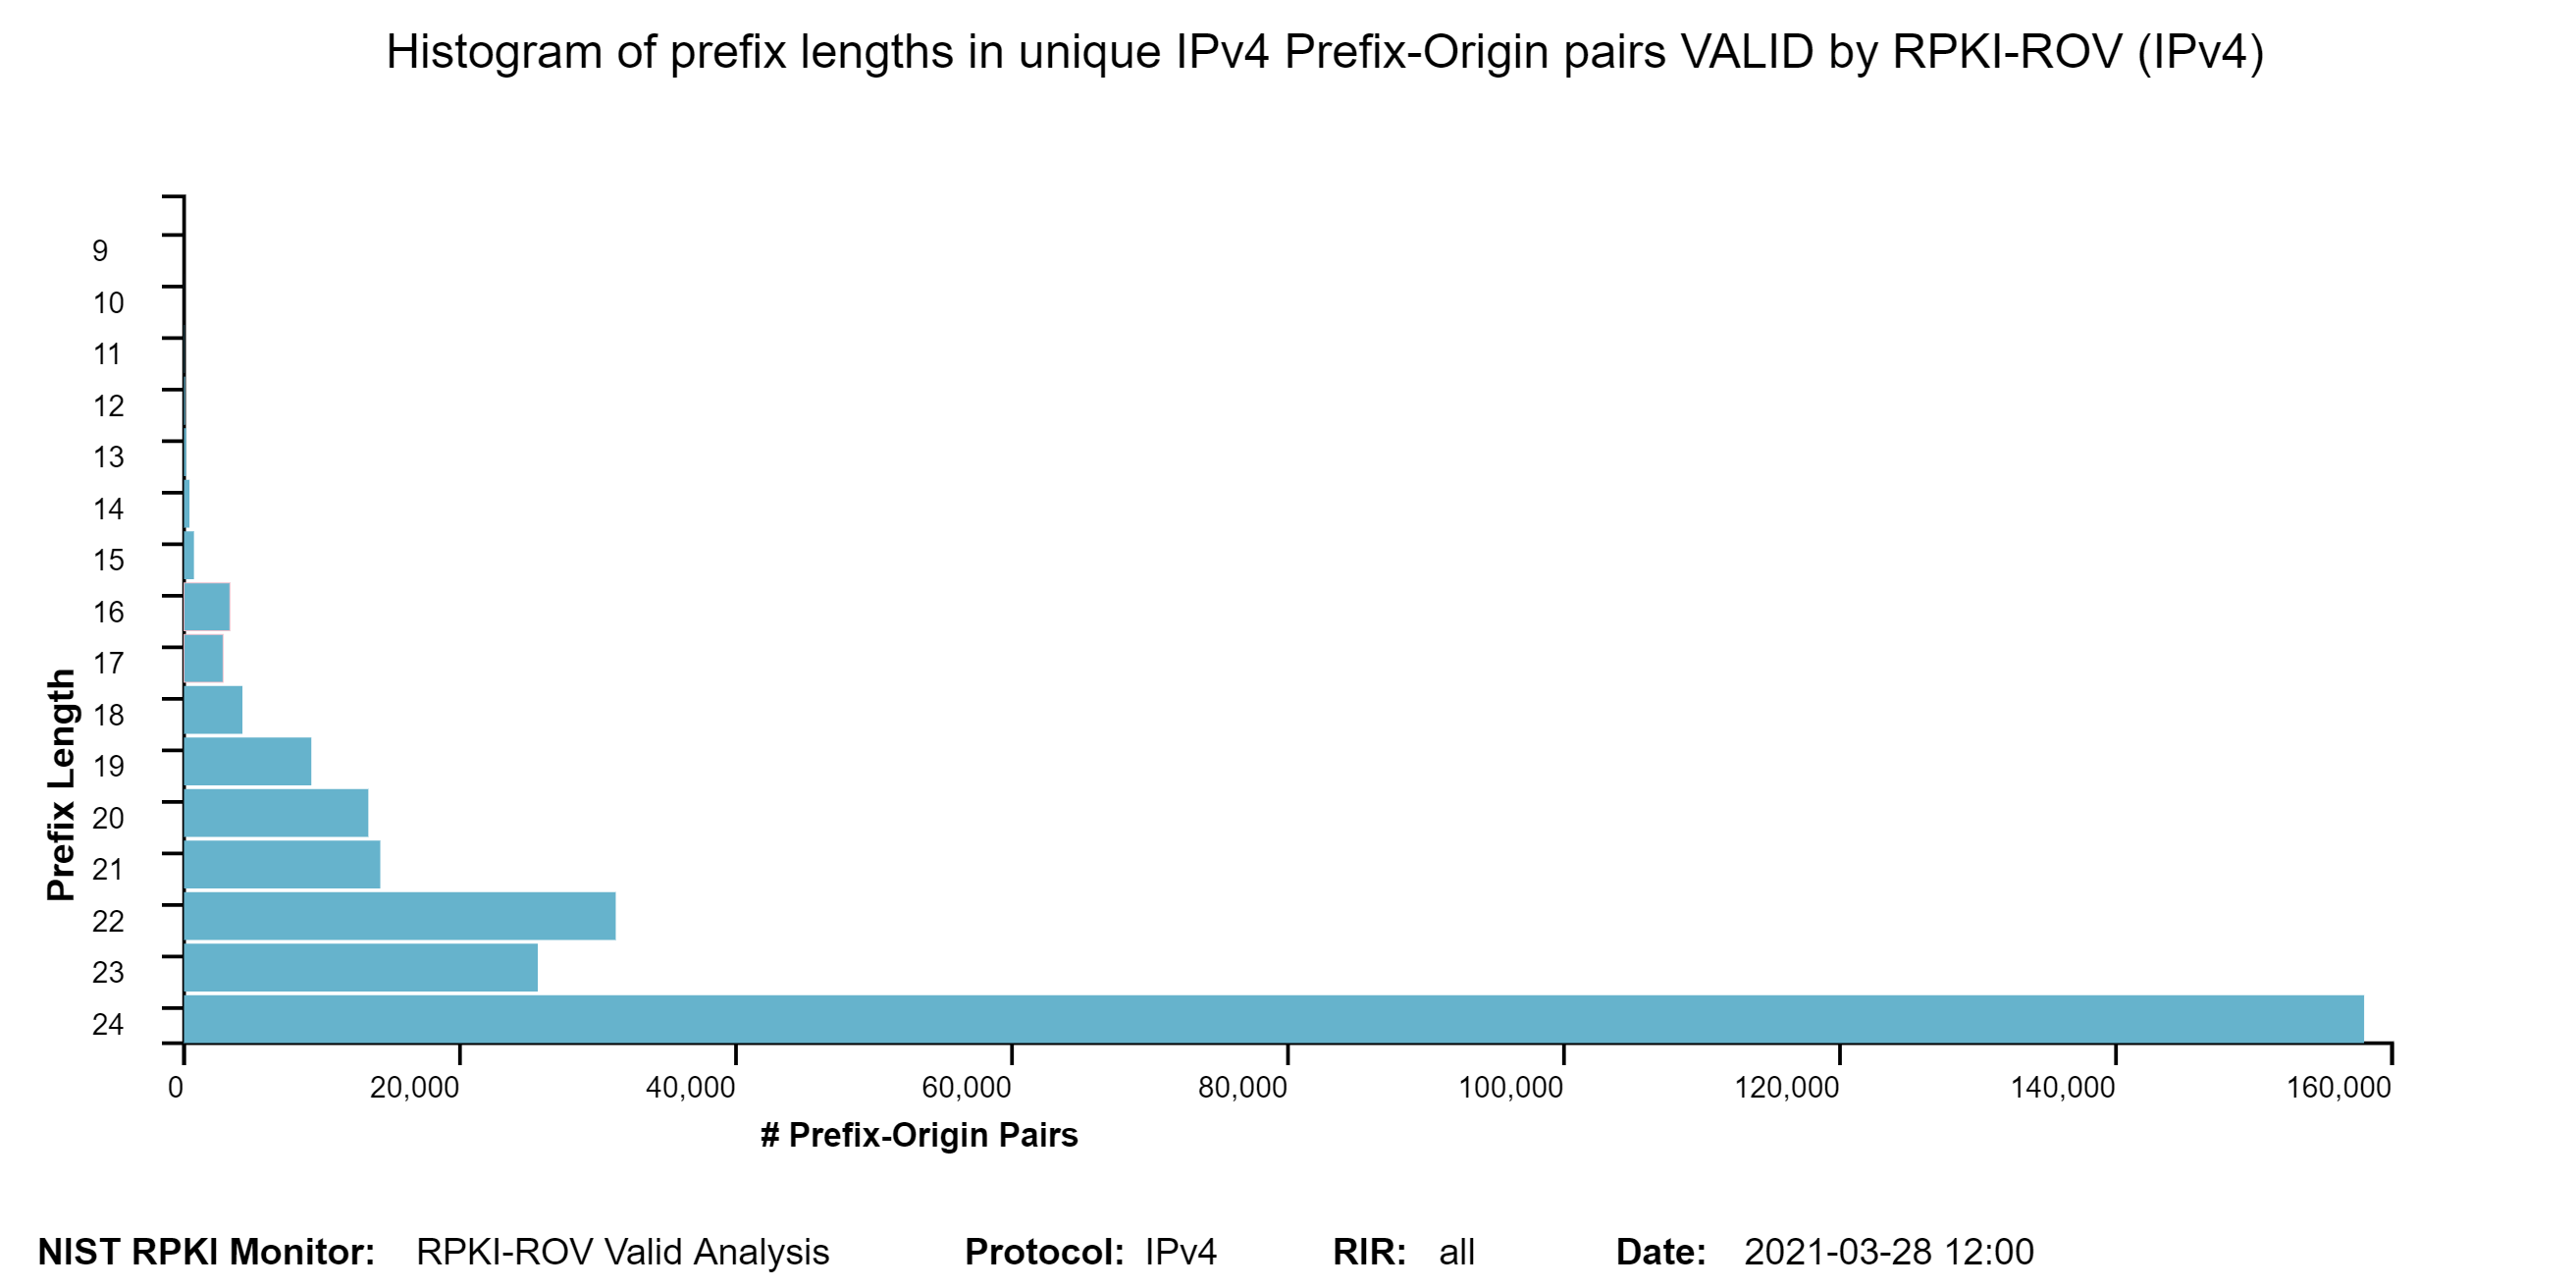
RPKI-ROV Analysis: Not-Found Originations
To get a detailed view of Prefix-Origin pairs that are NotFound by RPKI-ROV, we provide a set of analyses along the dimensions of the top 25 organizations, prefix length, and AS path length.
The NotFound [RFC 6811] Prefix-Origin pairs are further classified into the following two different categories:
- Not Found: This is the normal case of NotFound. Origin AS was determinable from the BGP update used to announce the prefix and a Covering ROA Prefix was not found.
- Not Found:AS-SET Origin AS could not be determined from the BGP update used to announce the prefix (i.e., because it contains an AS-SET), and a Covering ROA Prefix was not found.
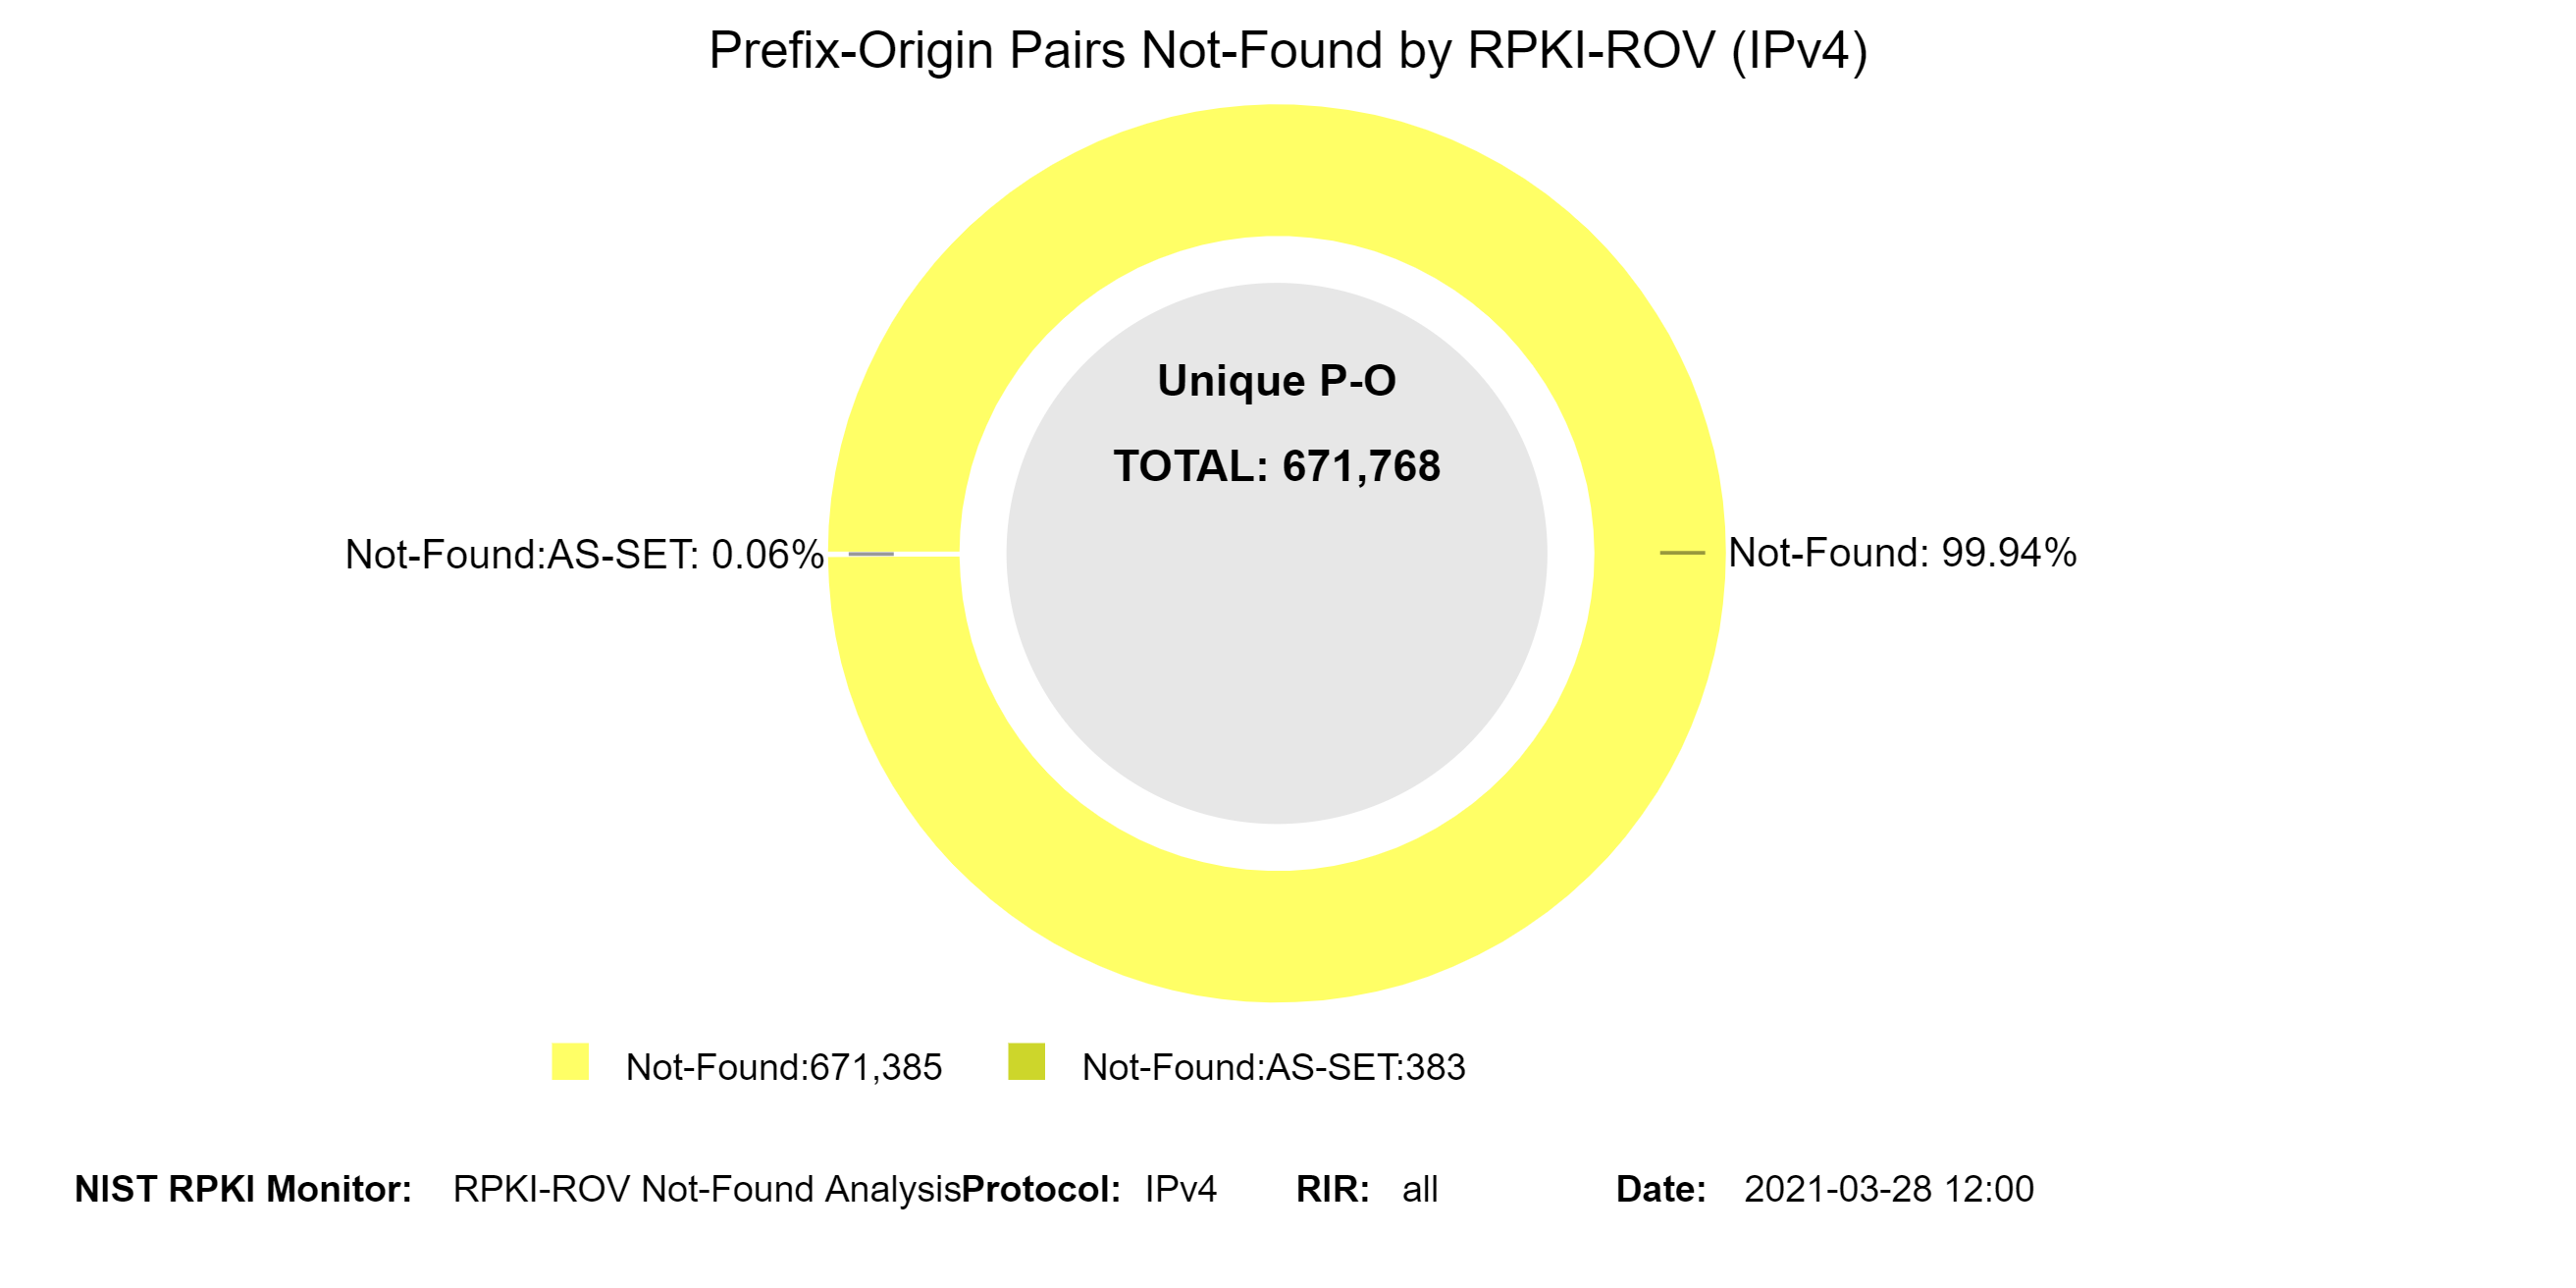
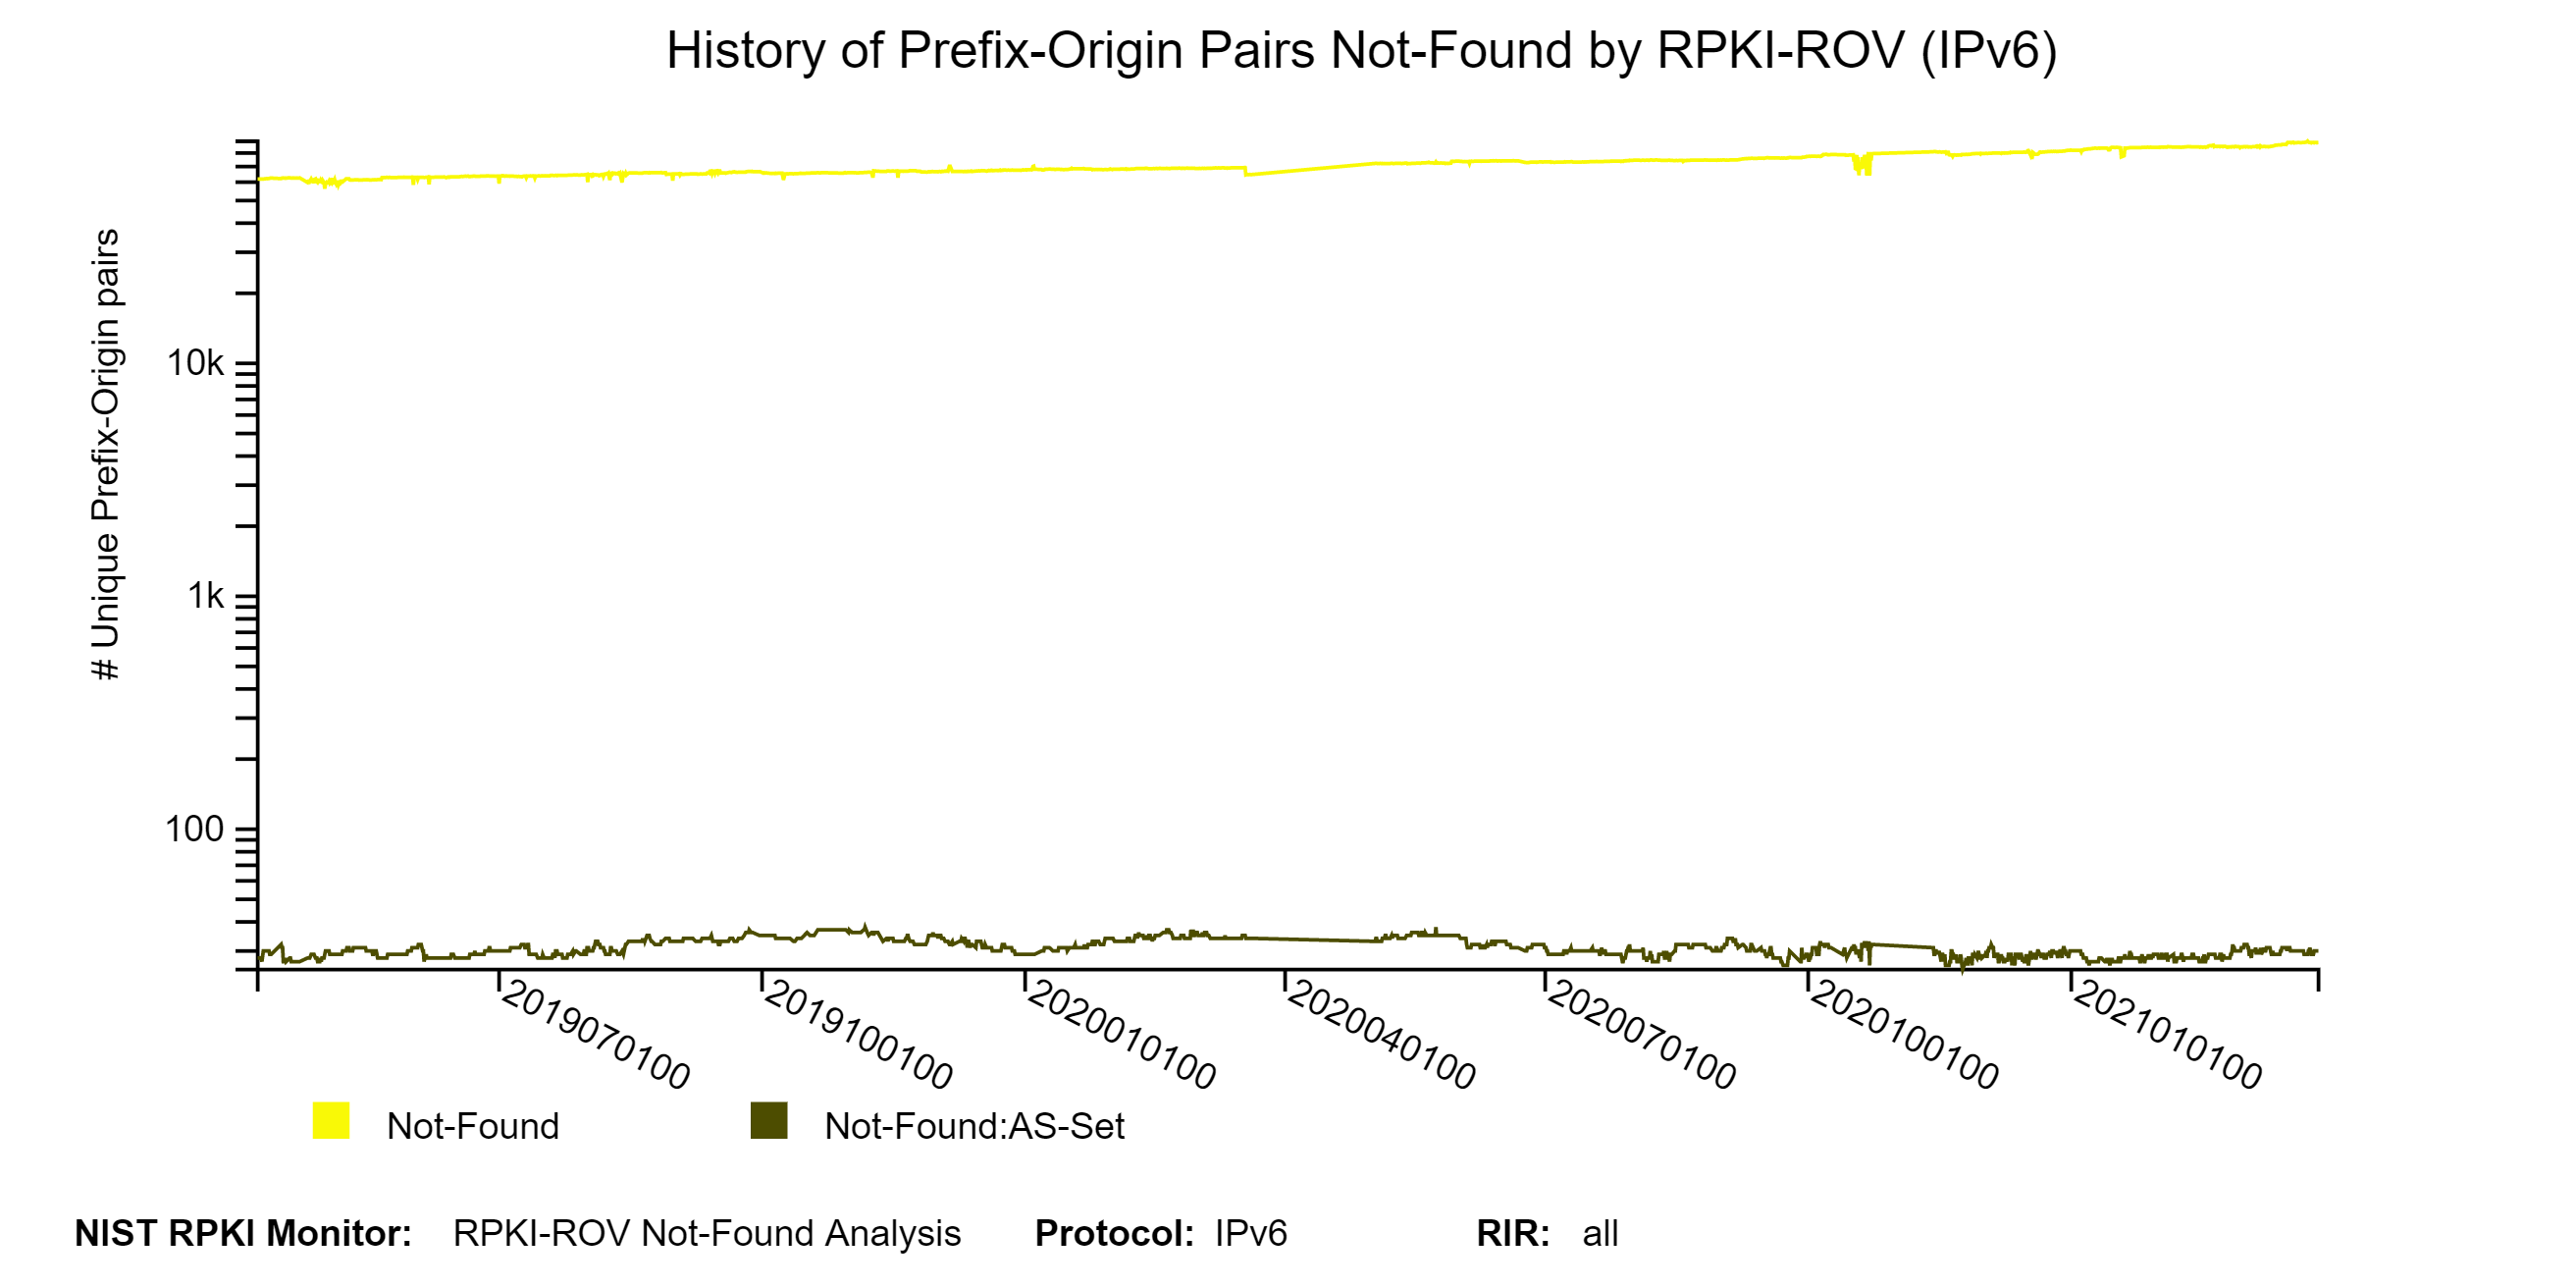
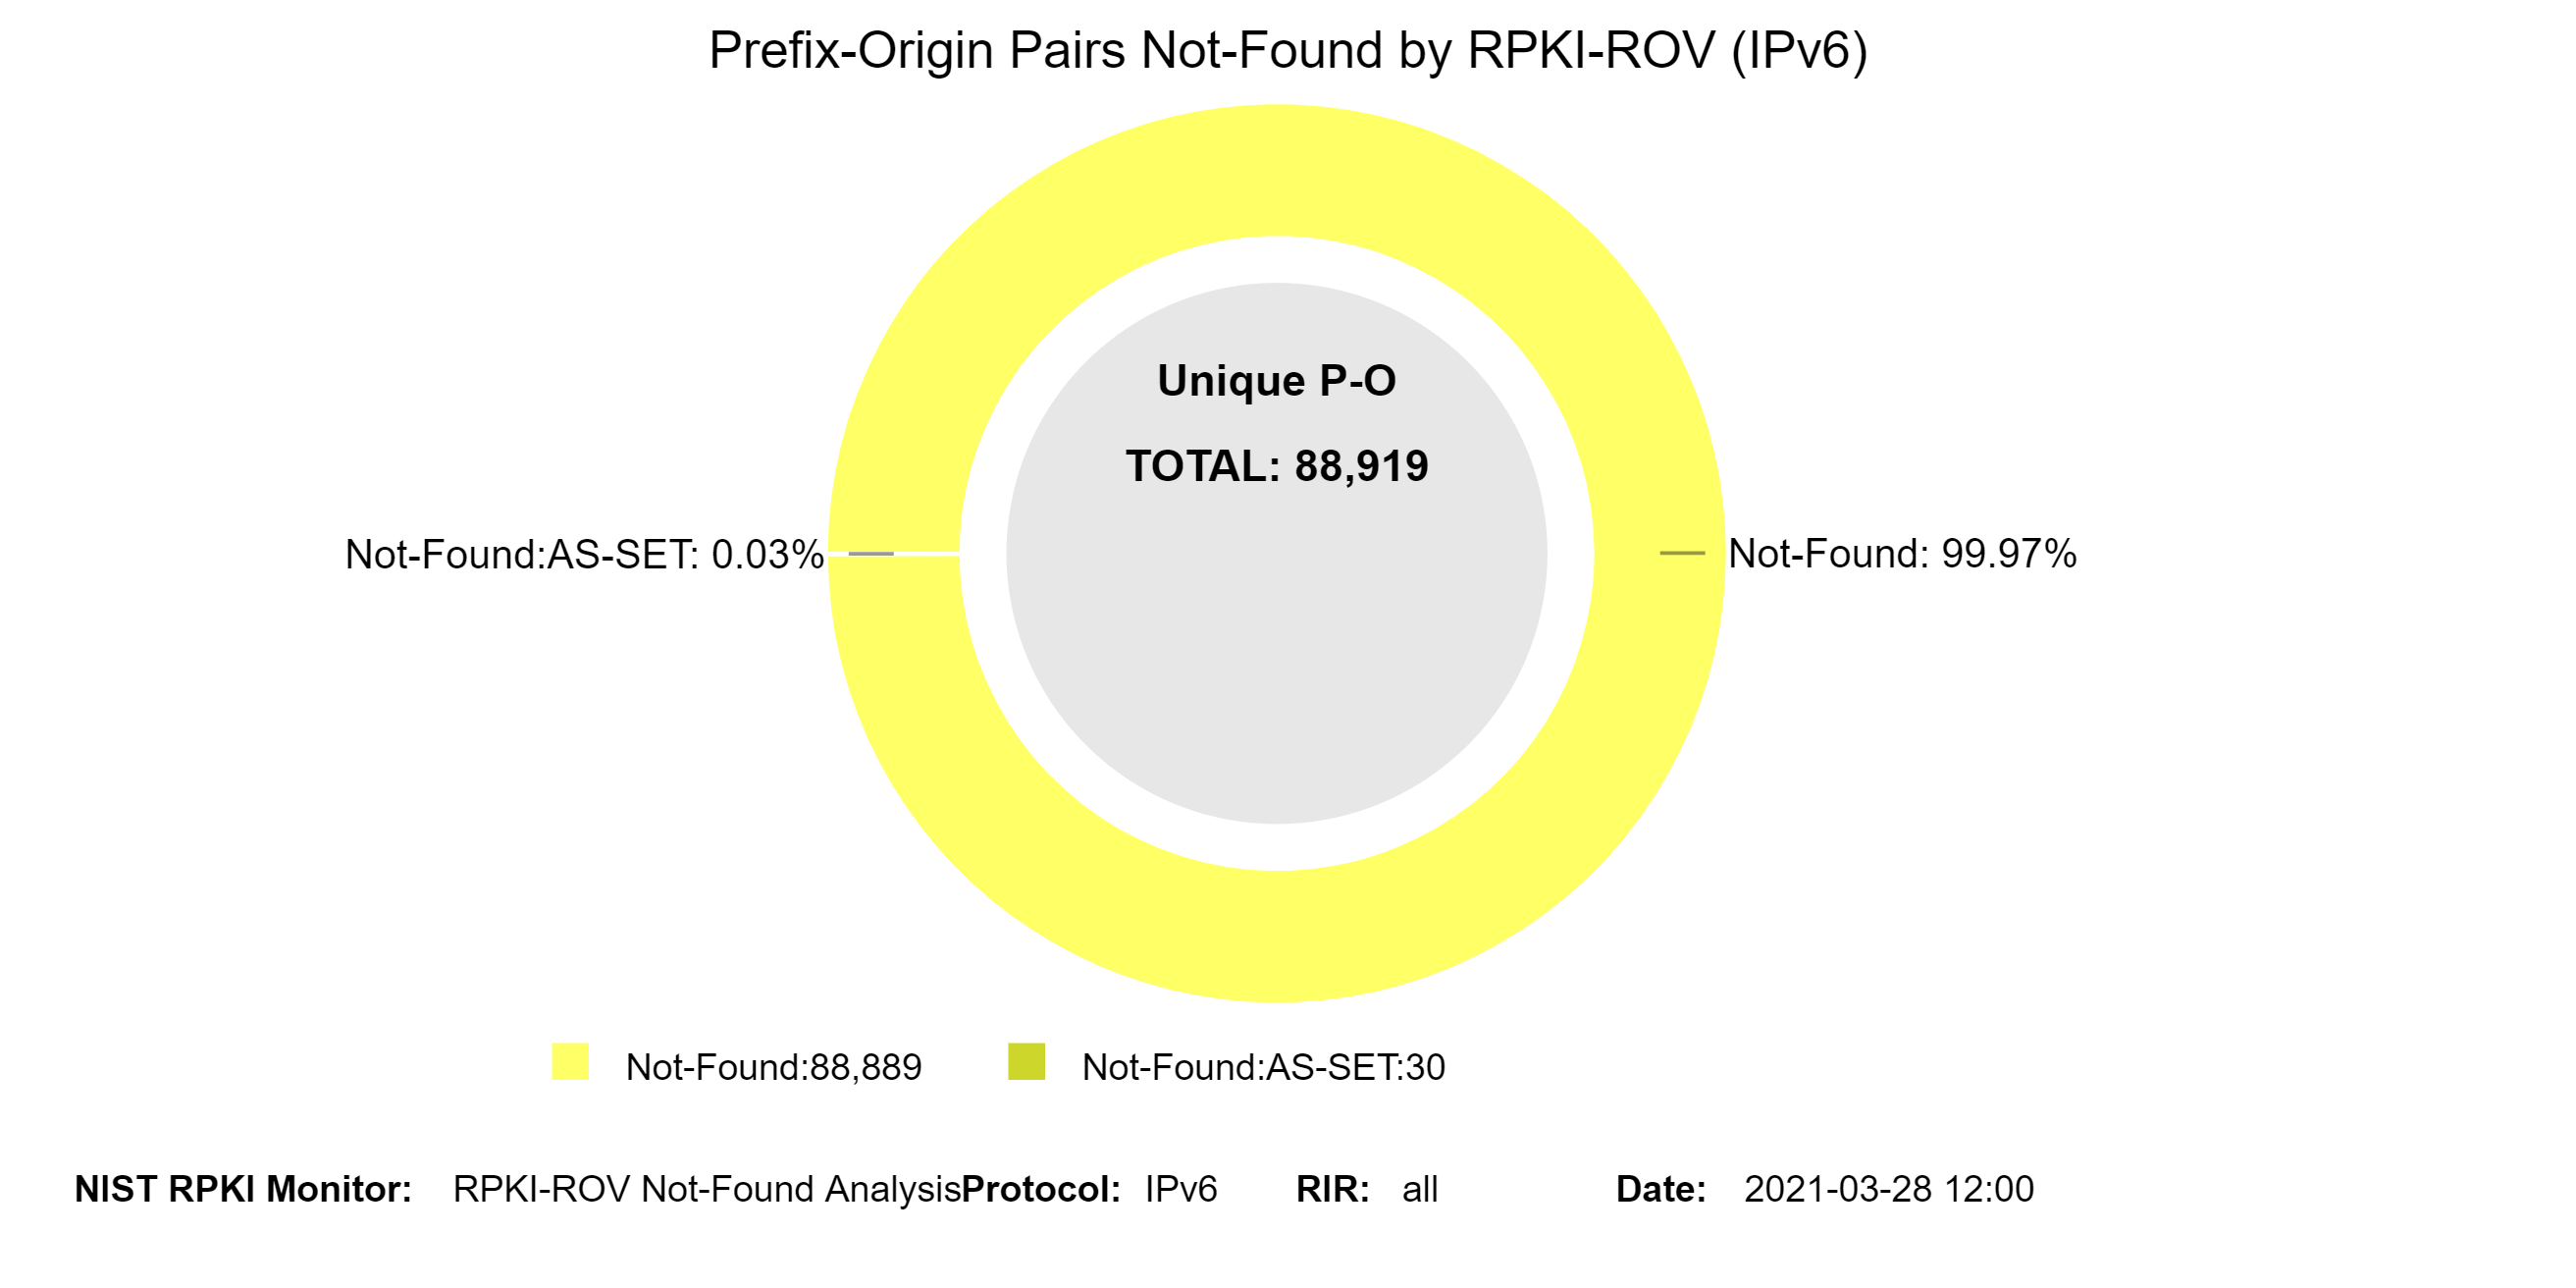 The graphs below show the history of the details (with a breakdown in terms of Not-Found and Not-Found:AS-SET) of unique IPv4 and IPv6 Prefix-Origin pairs that were Not-Found (jump to this analysis).
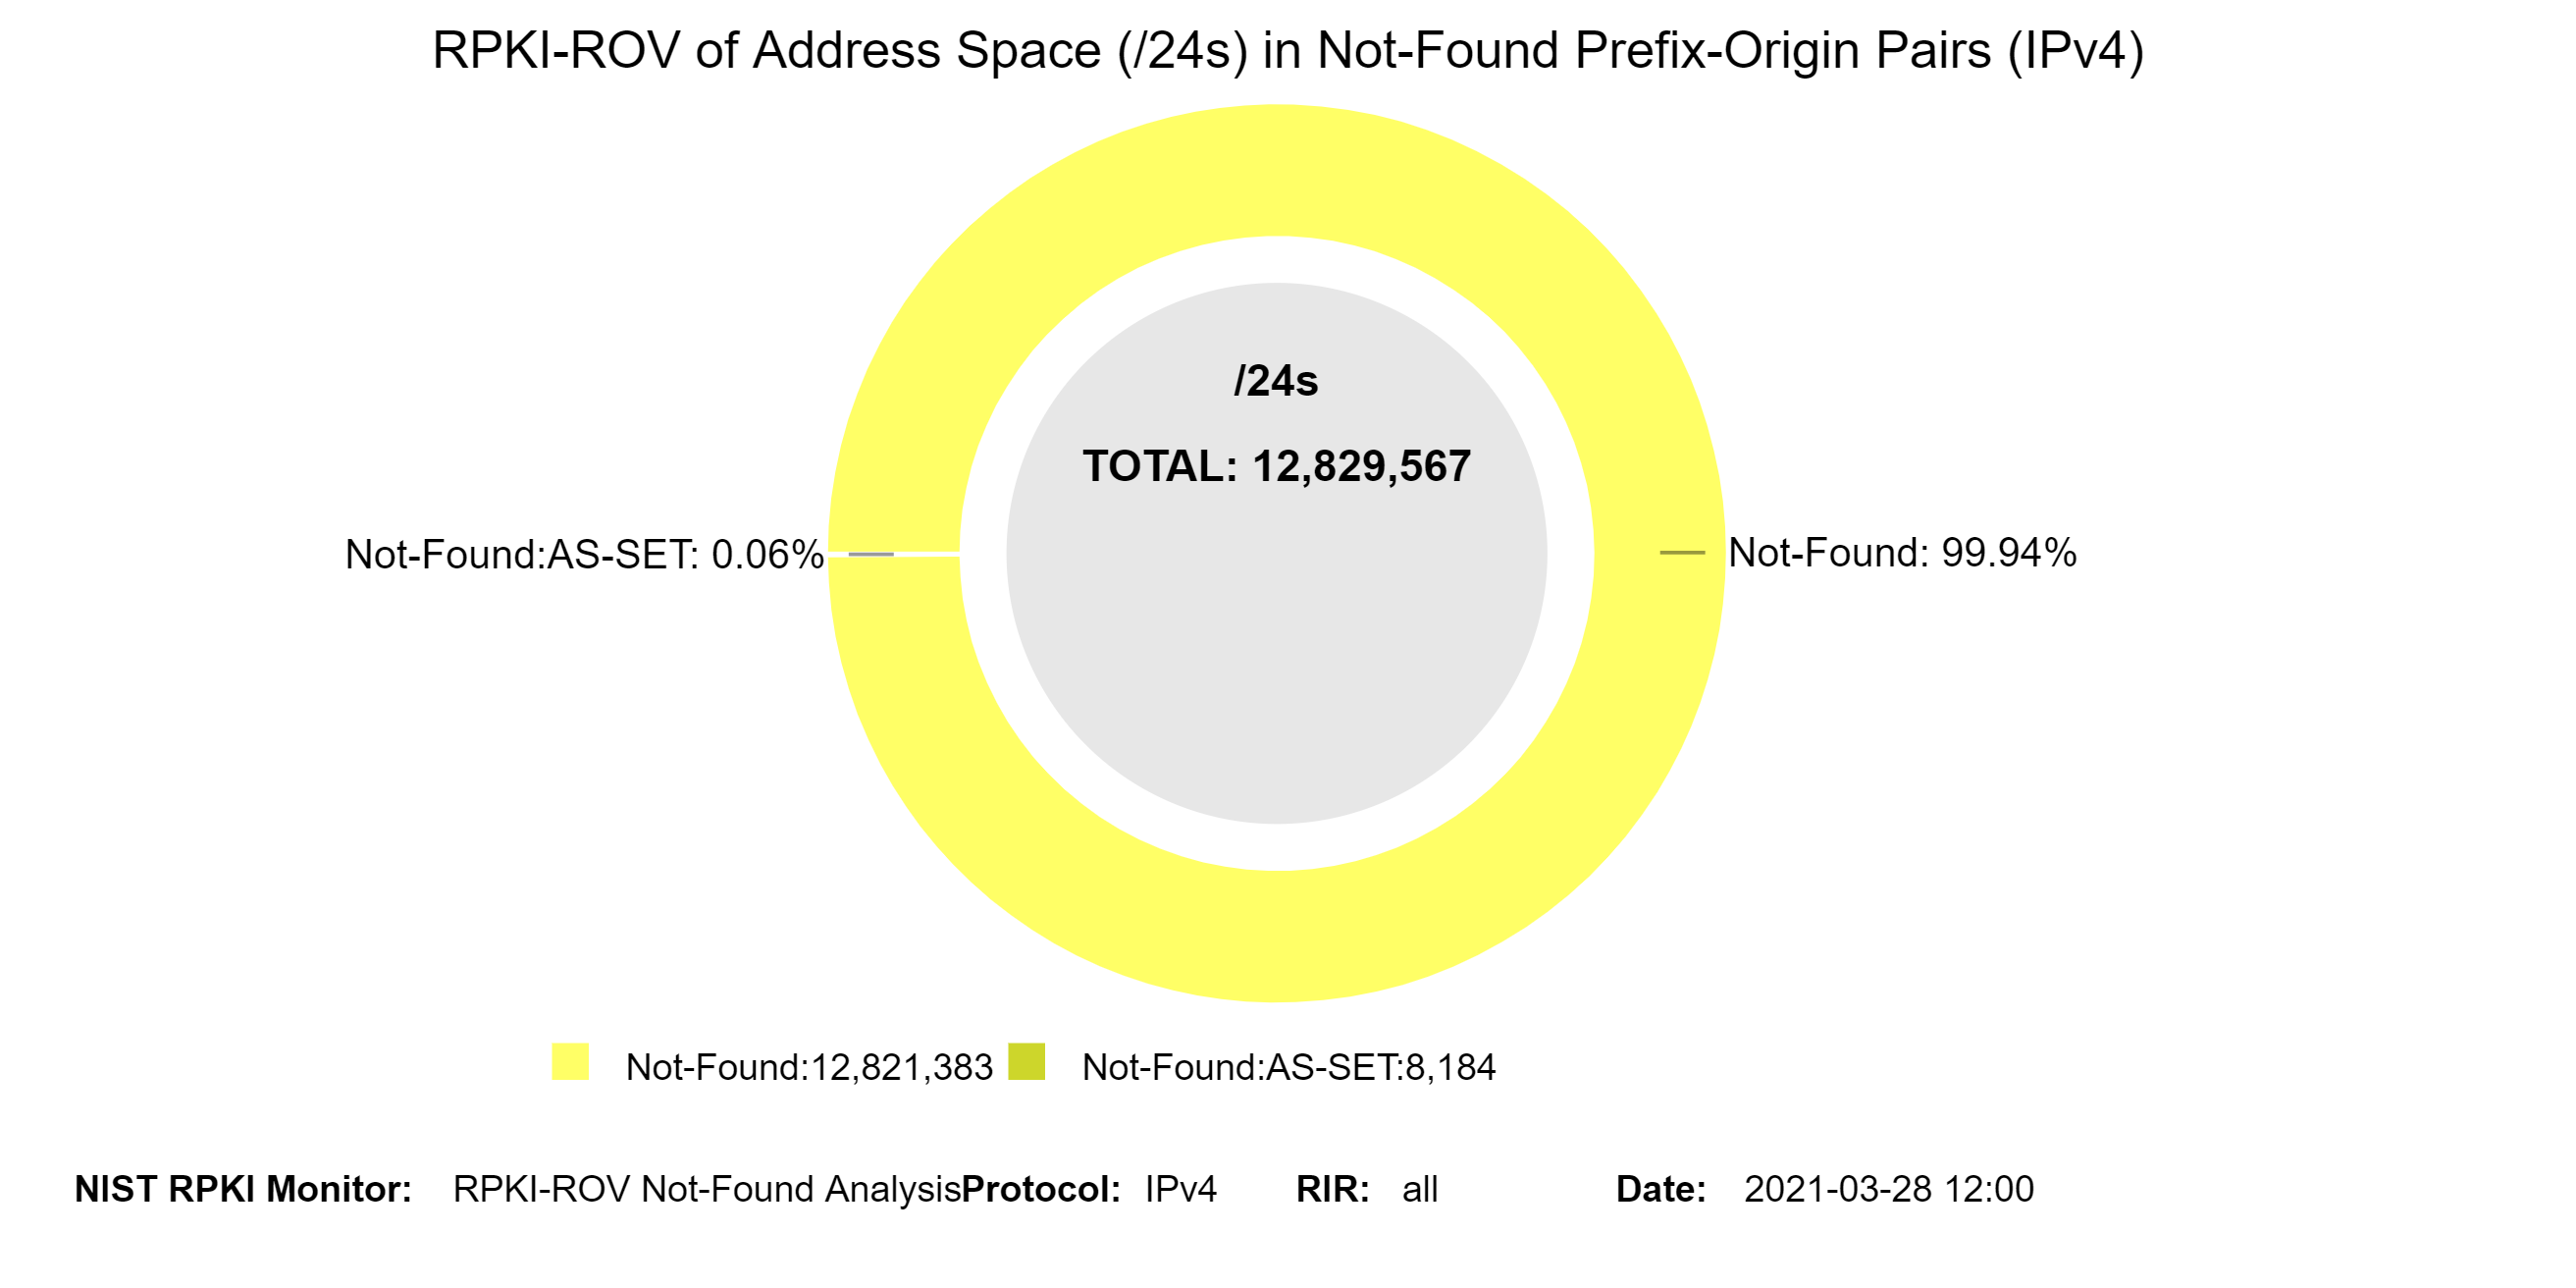
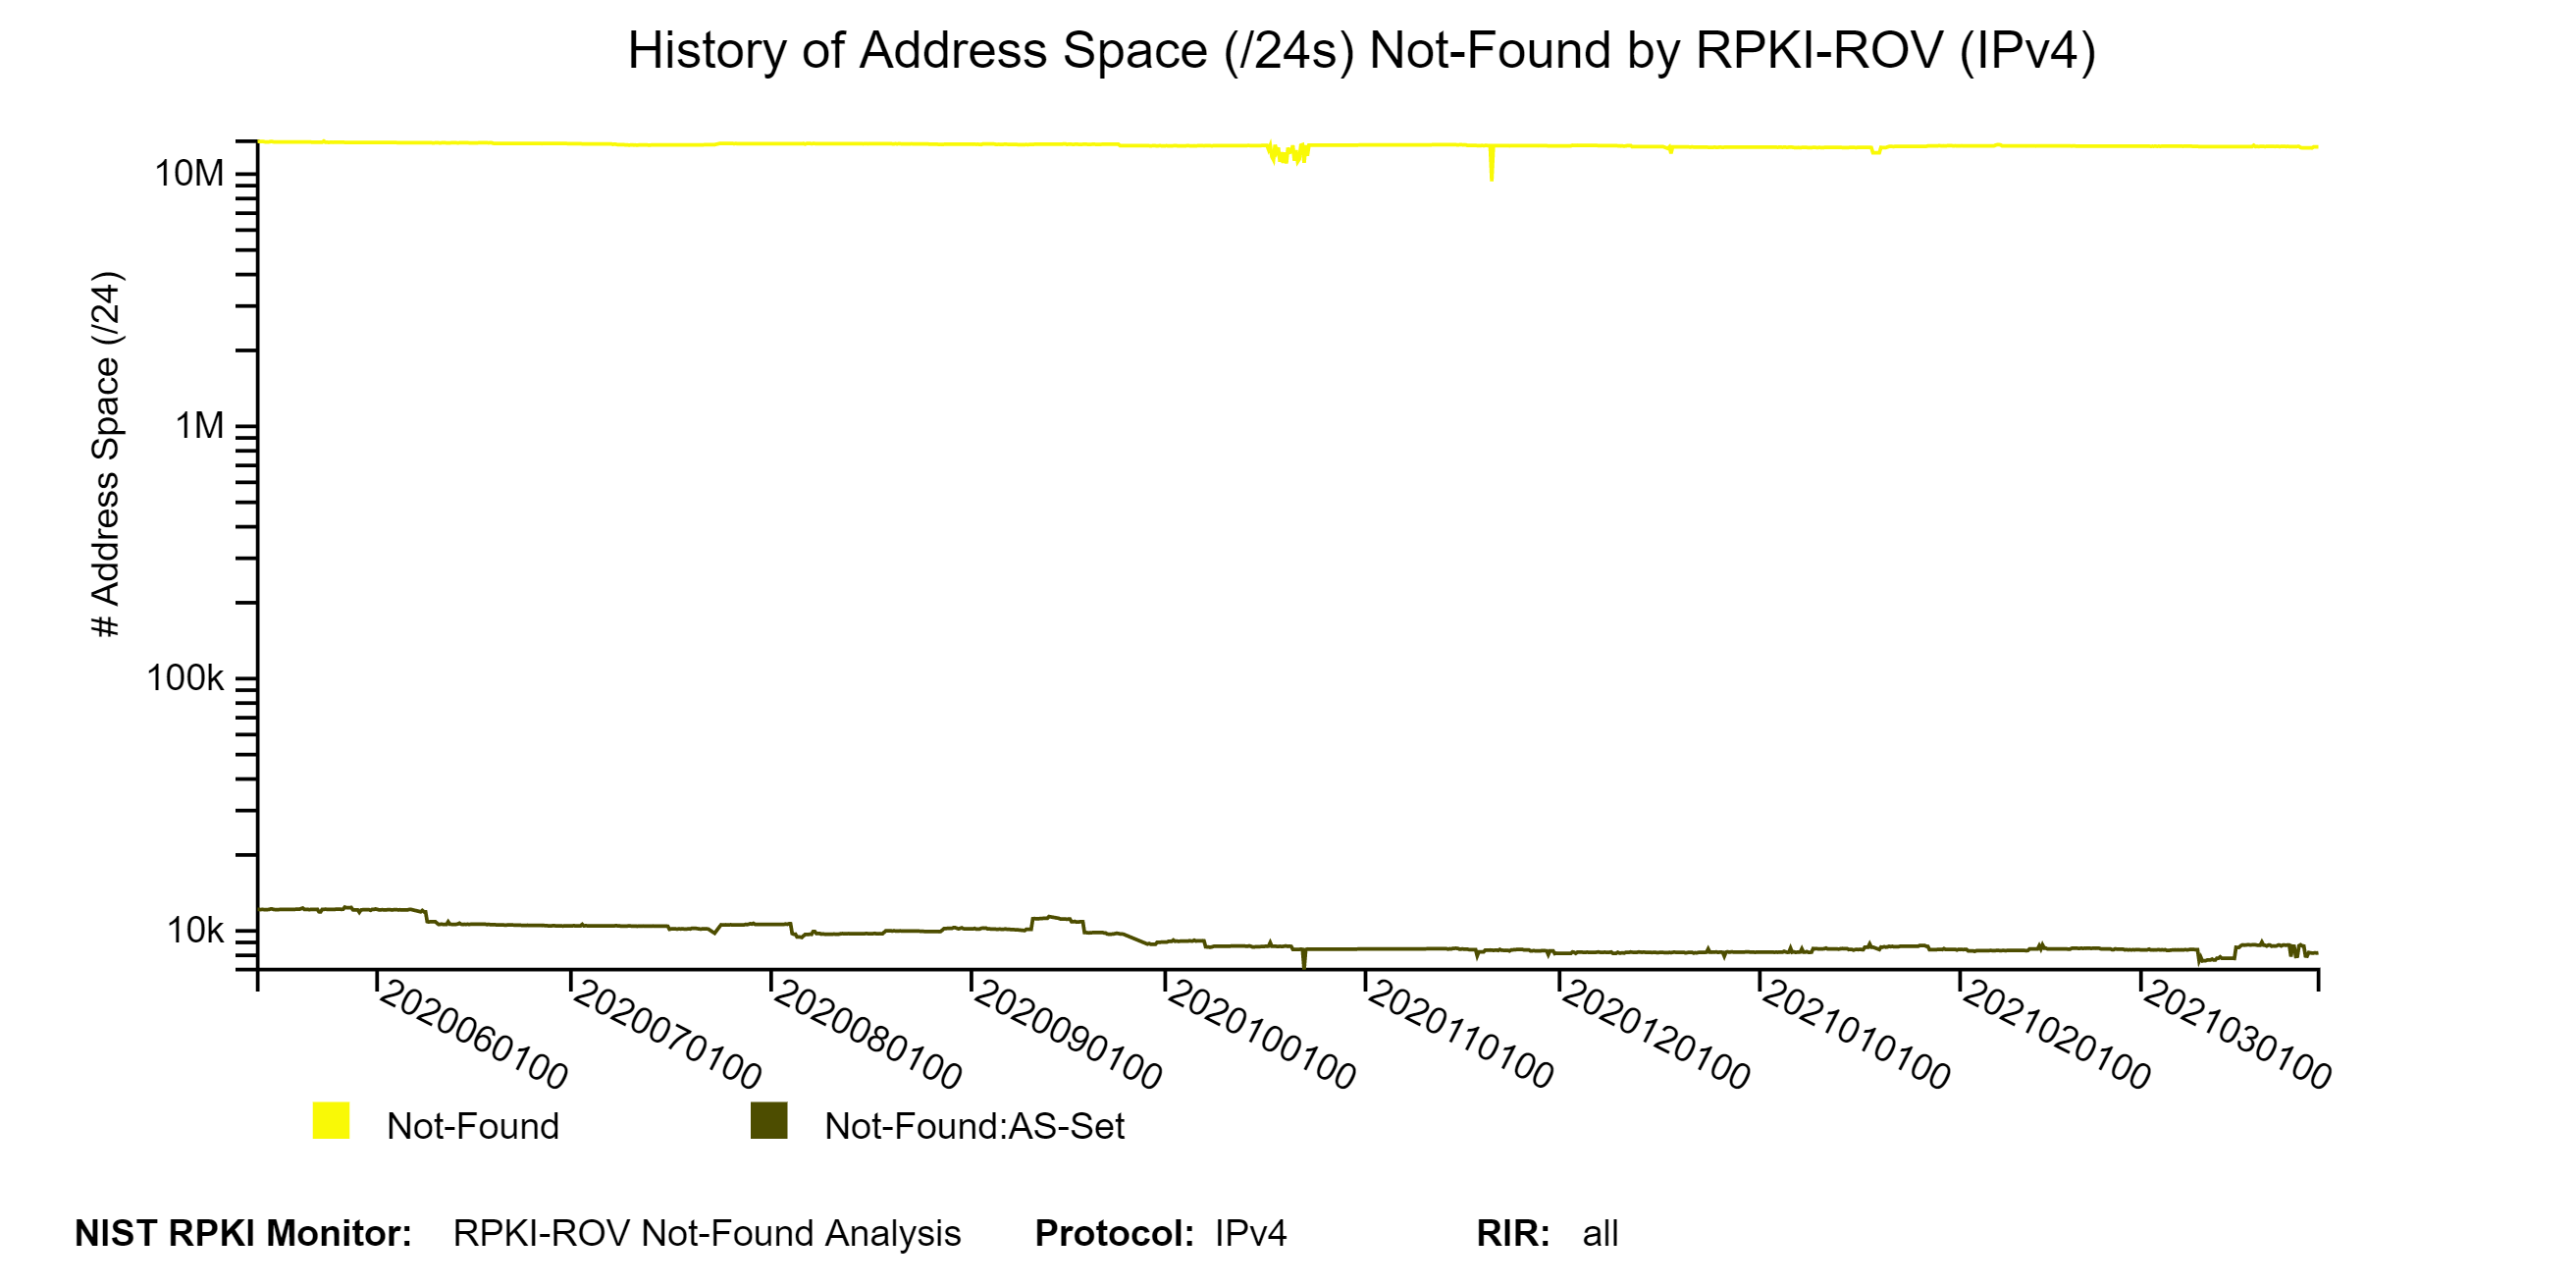
The graph below represents a snapshot of the details of the Not-Found address space (in /24s) for IPv4. They show the breakdown in terms of Not-Found and Not-Found:AS-SET. The second graph below shows the history of the details of the Not-Found address space (in /24s) for IPv4 (jump to this analysis).
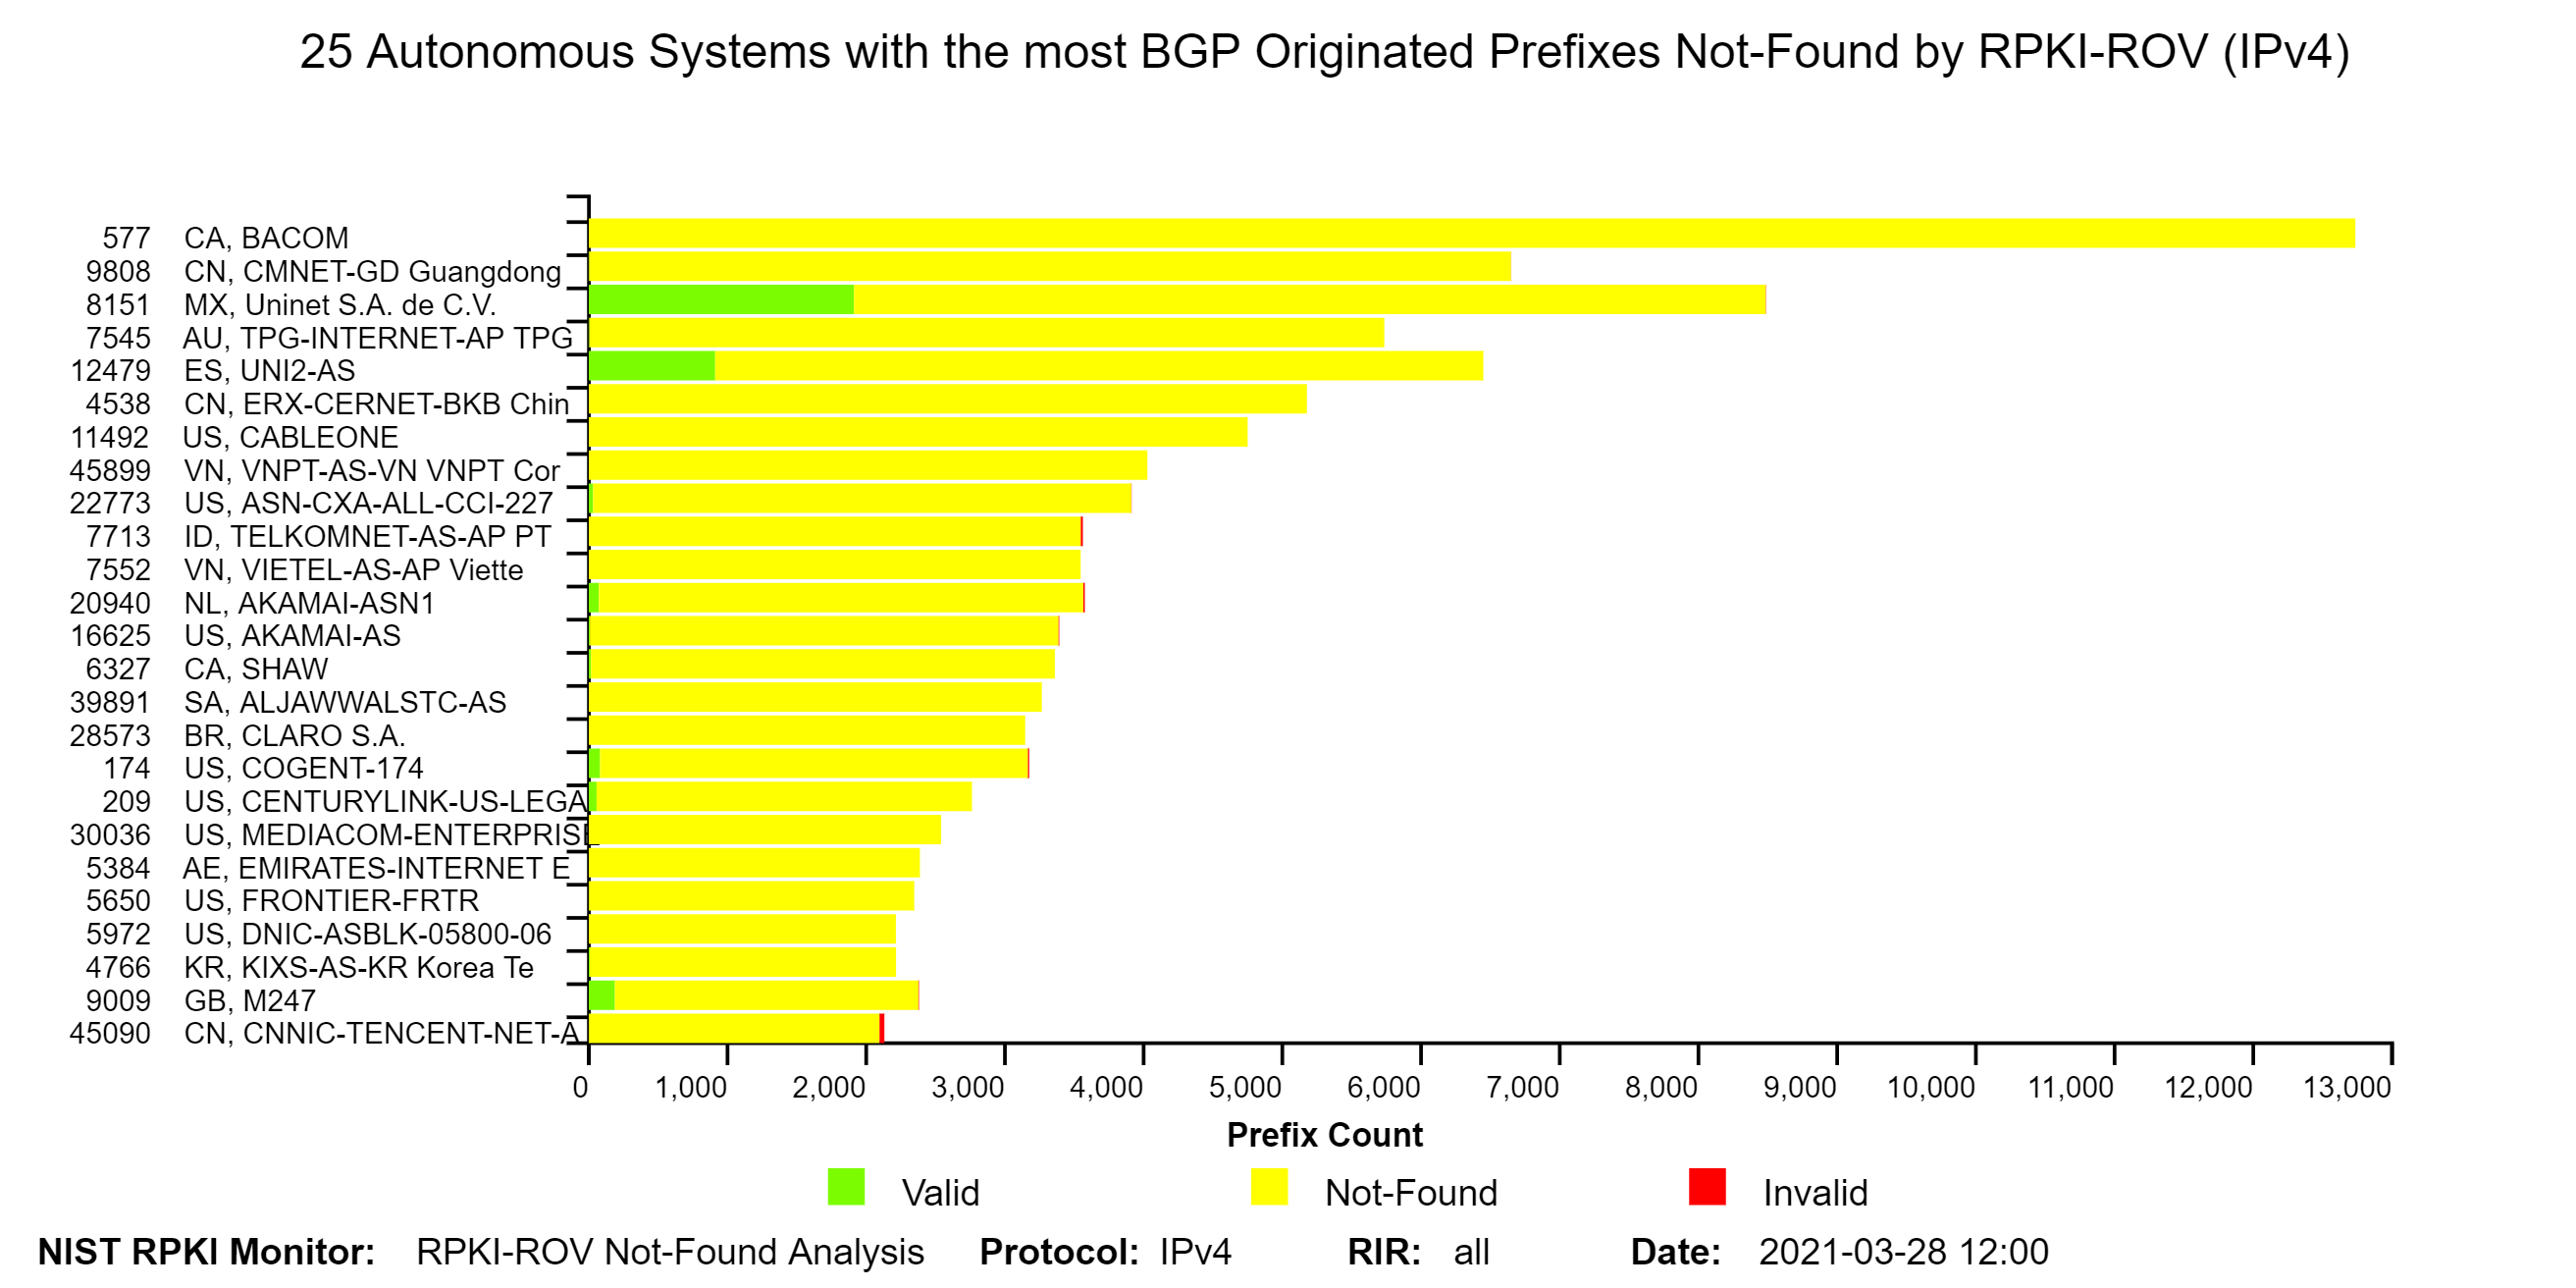
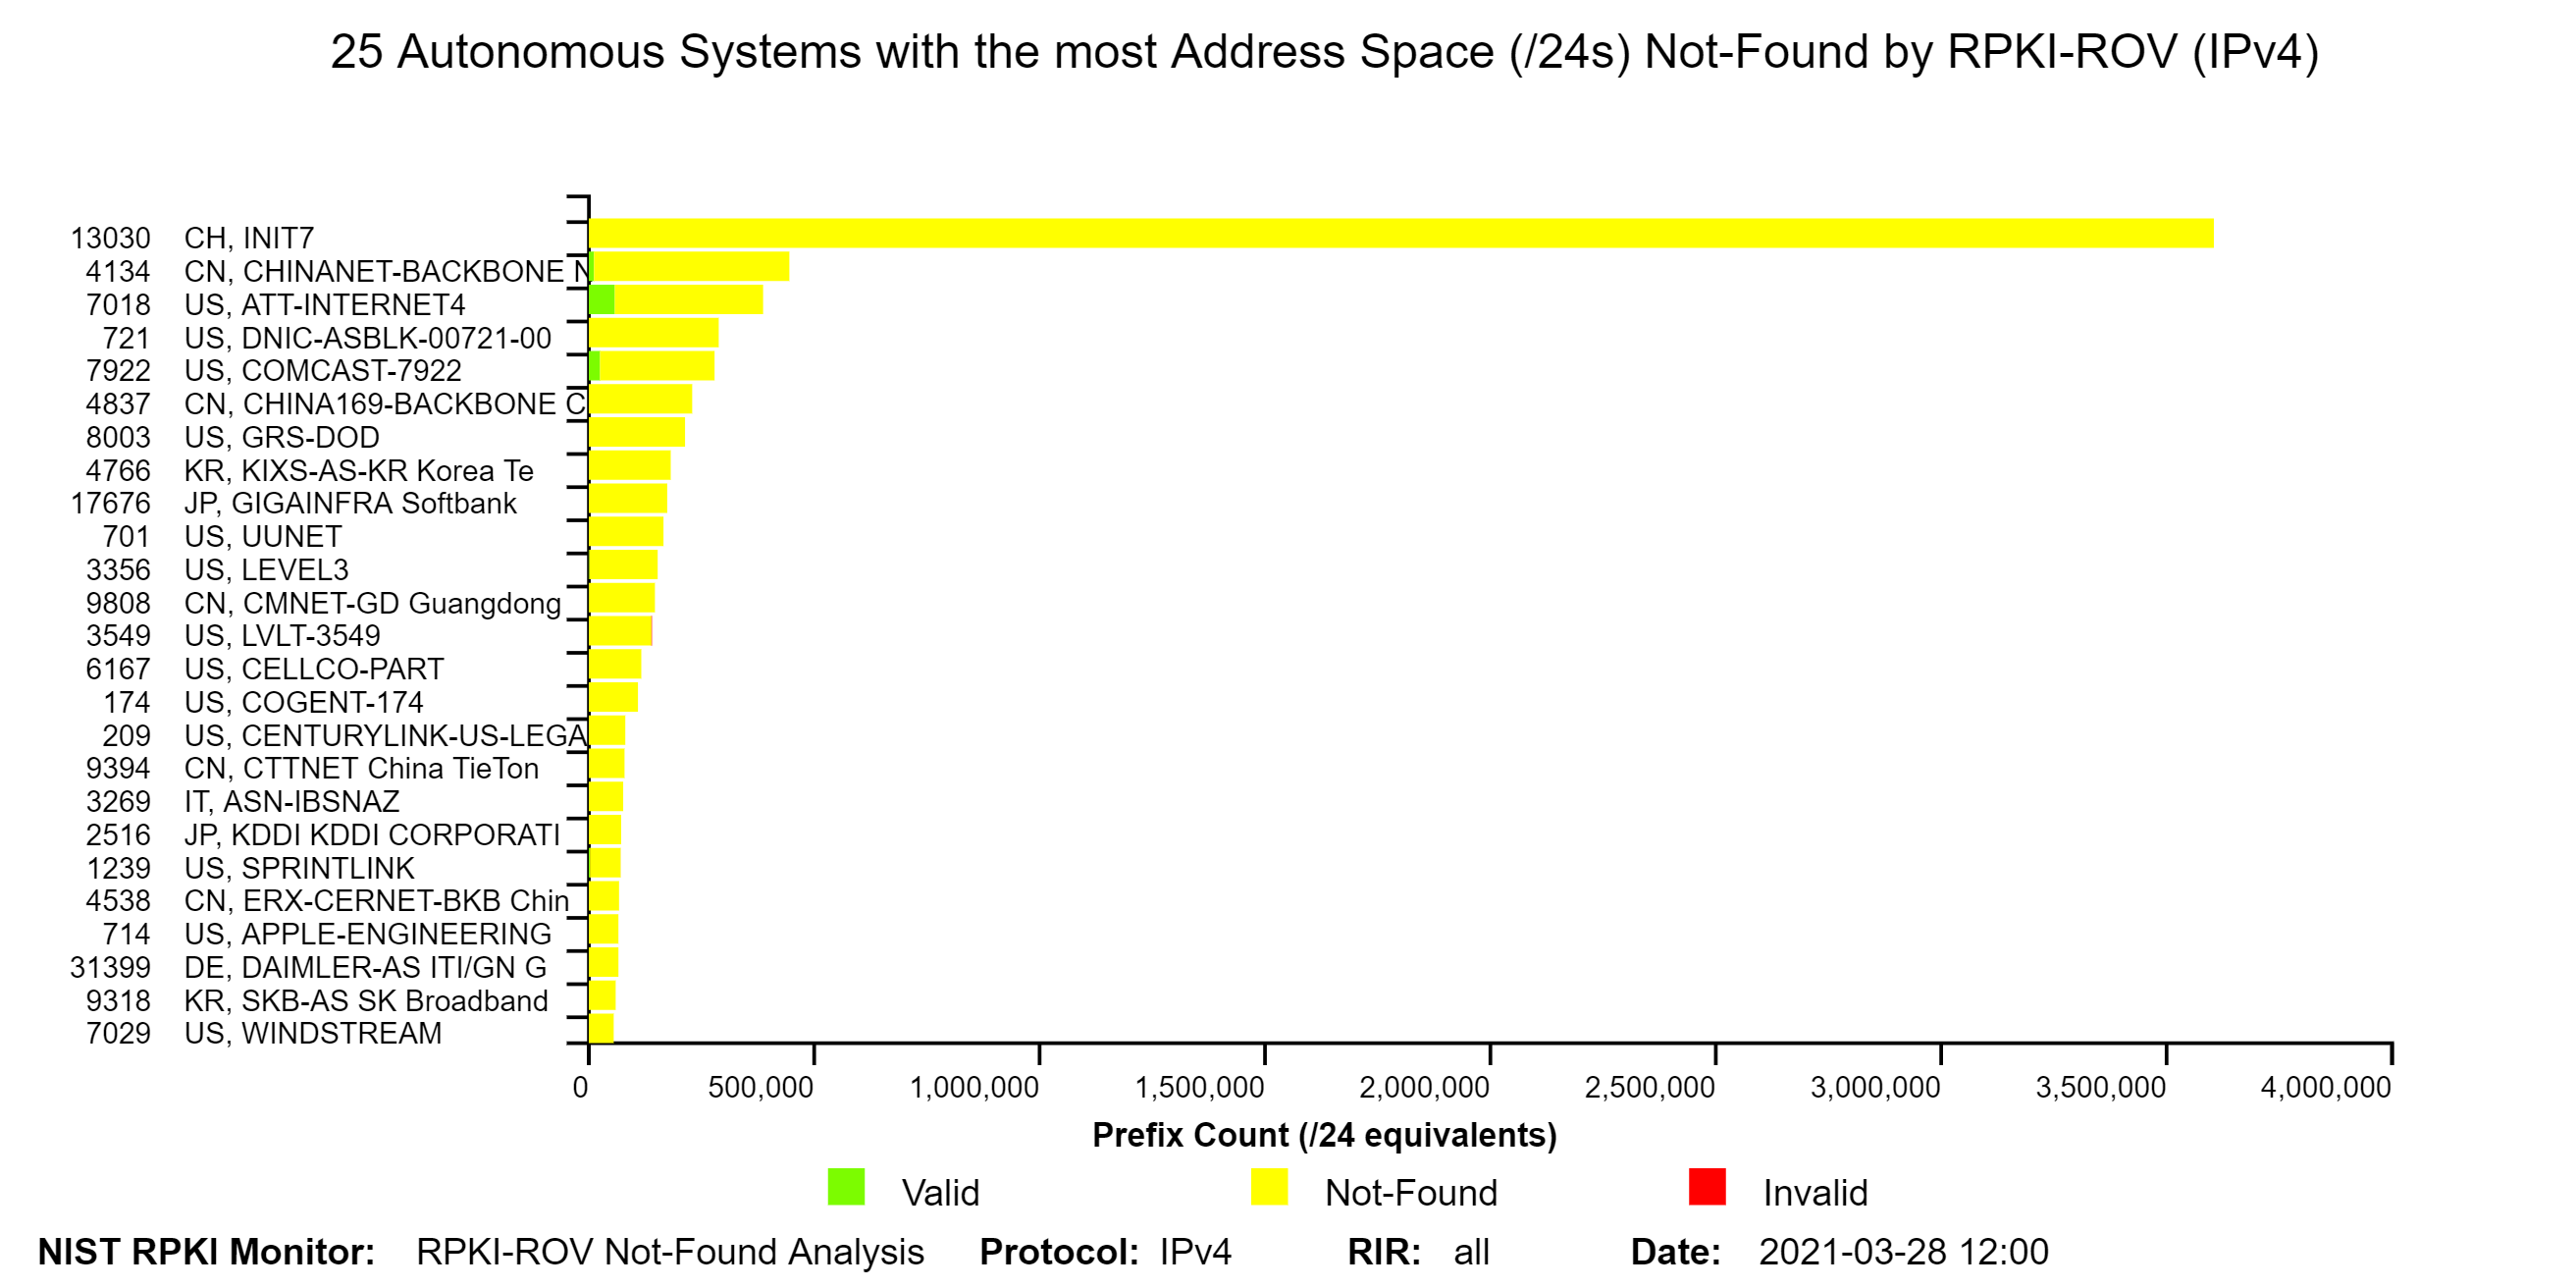
The two graphs below depict the top 25 Autonomous Systems (ASes) with the most BGP observed IPv4 prefixes Not-Found by RPKI-ROV and the top 25 ASes with the most IPv4 Address Space (/24s) Not-Found by RPKI-ROV. The organization names of the ASes are shown on the y-axis next to the AS numbers (ASNs). The IPv6 version of the first of these graphs is also available in the Monitor (jump to this analysis).
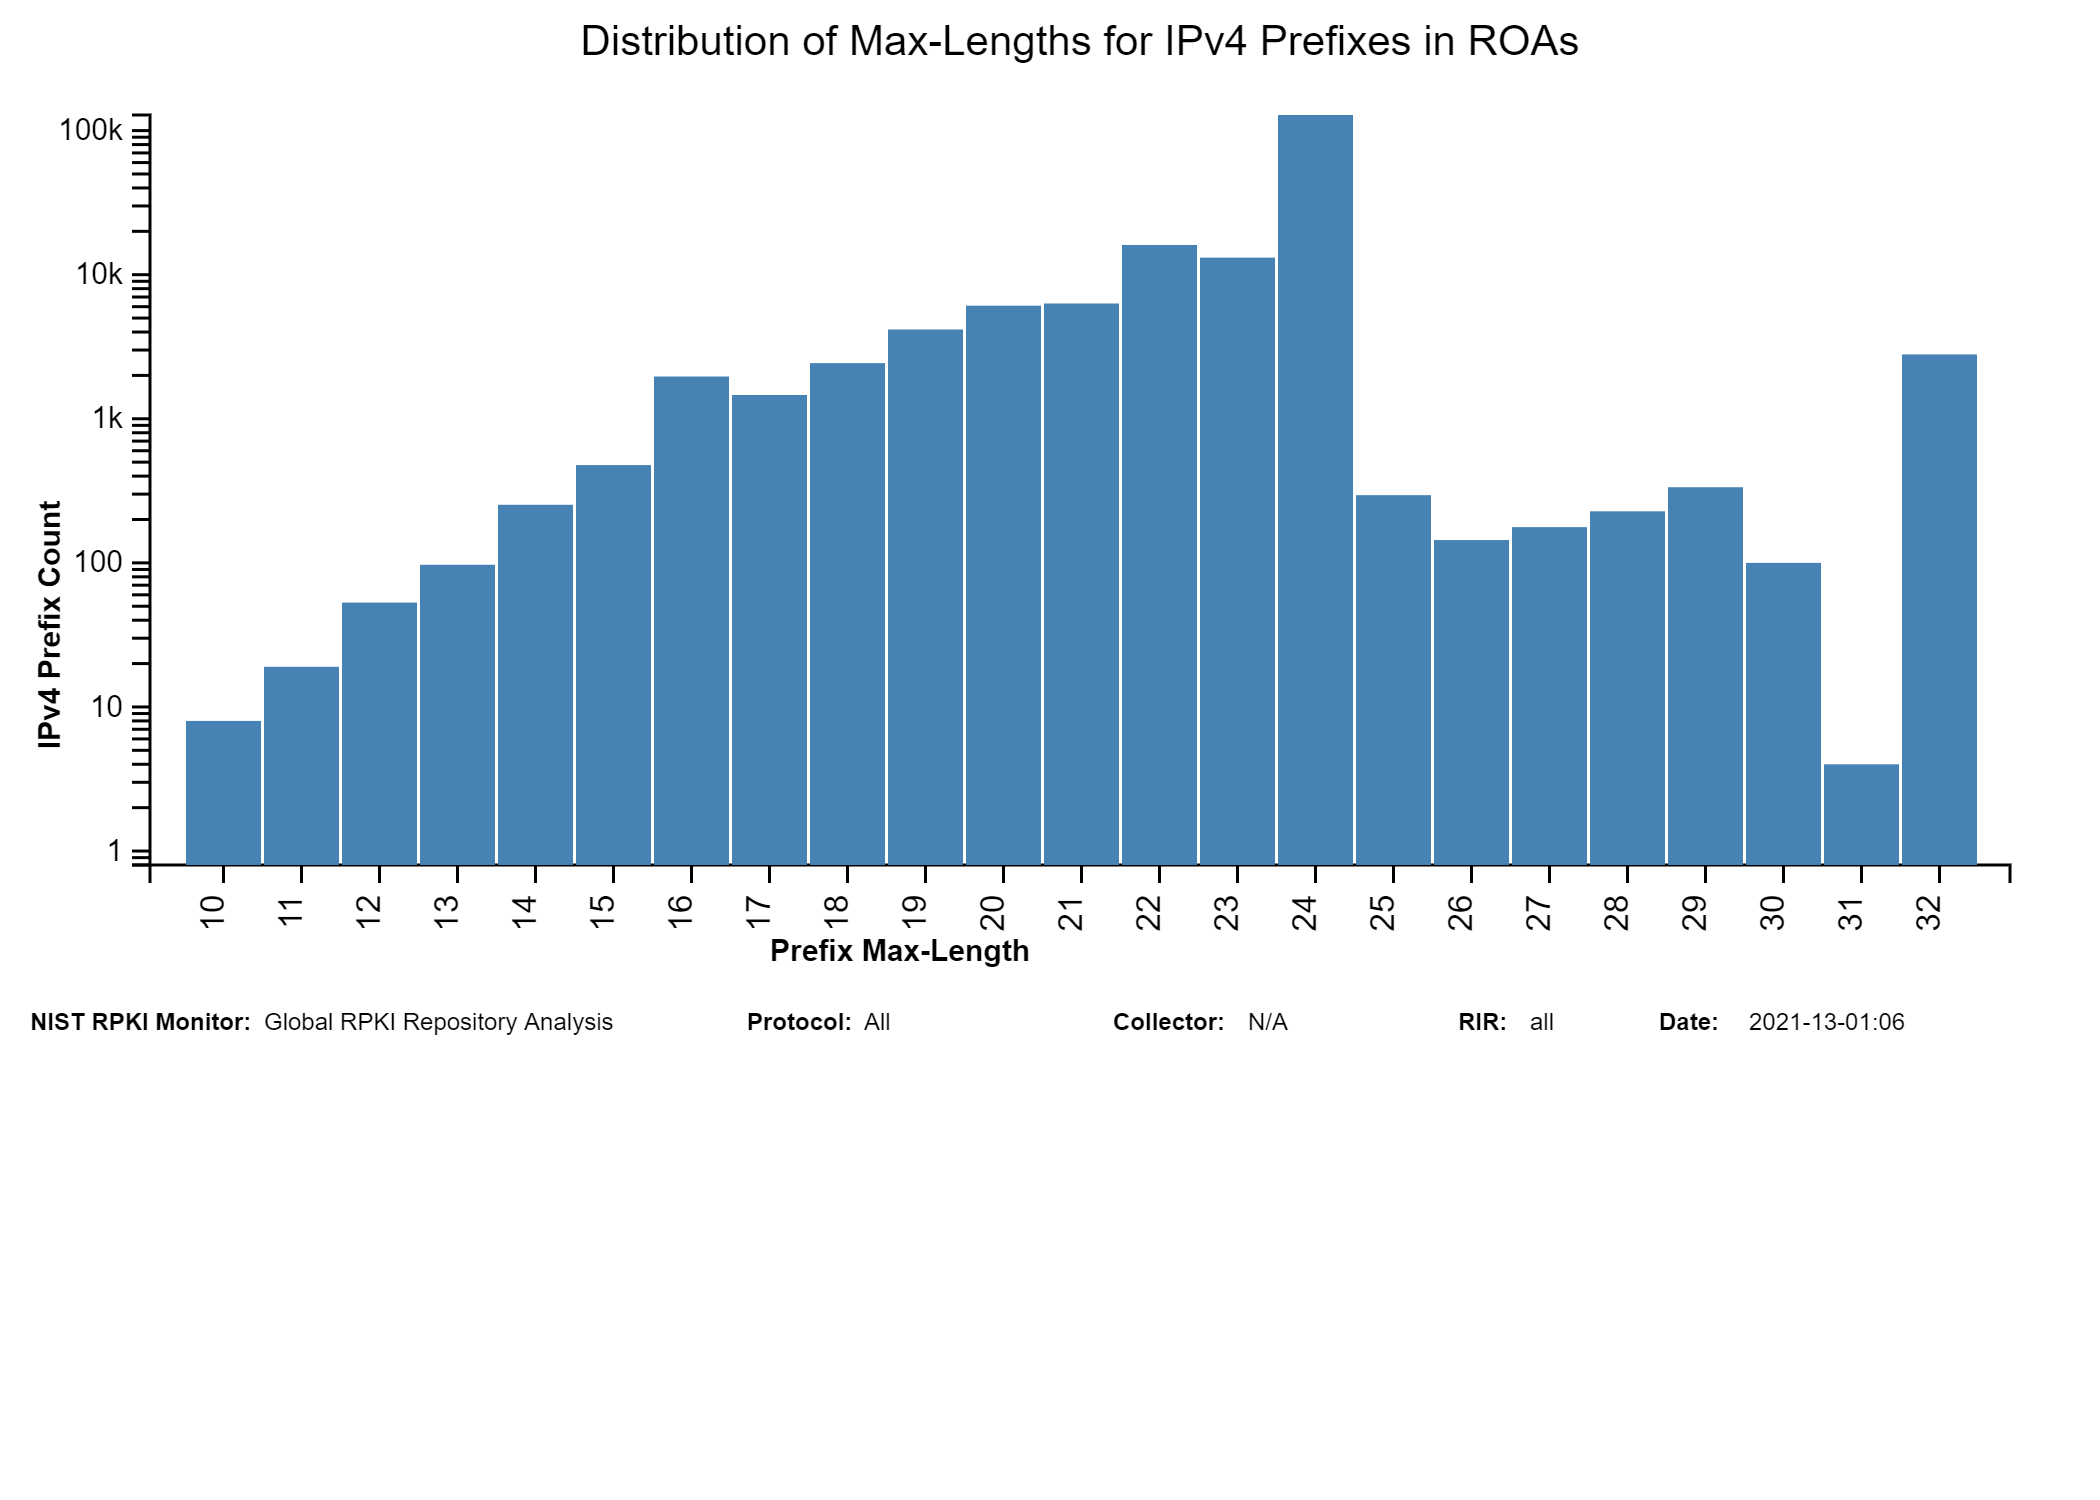
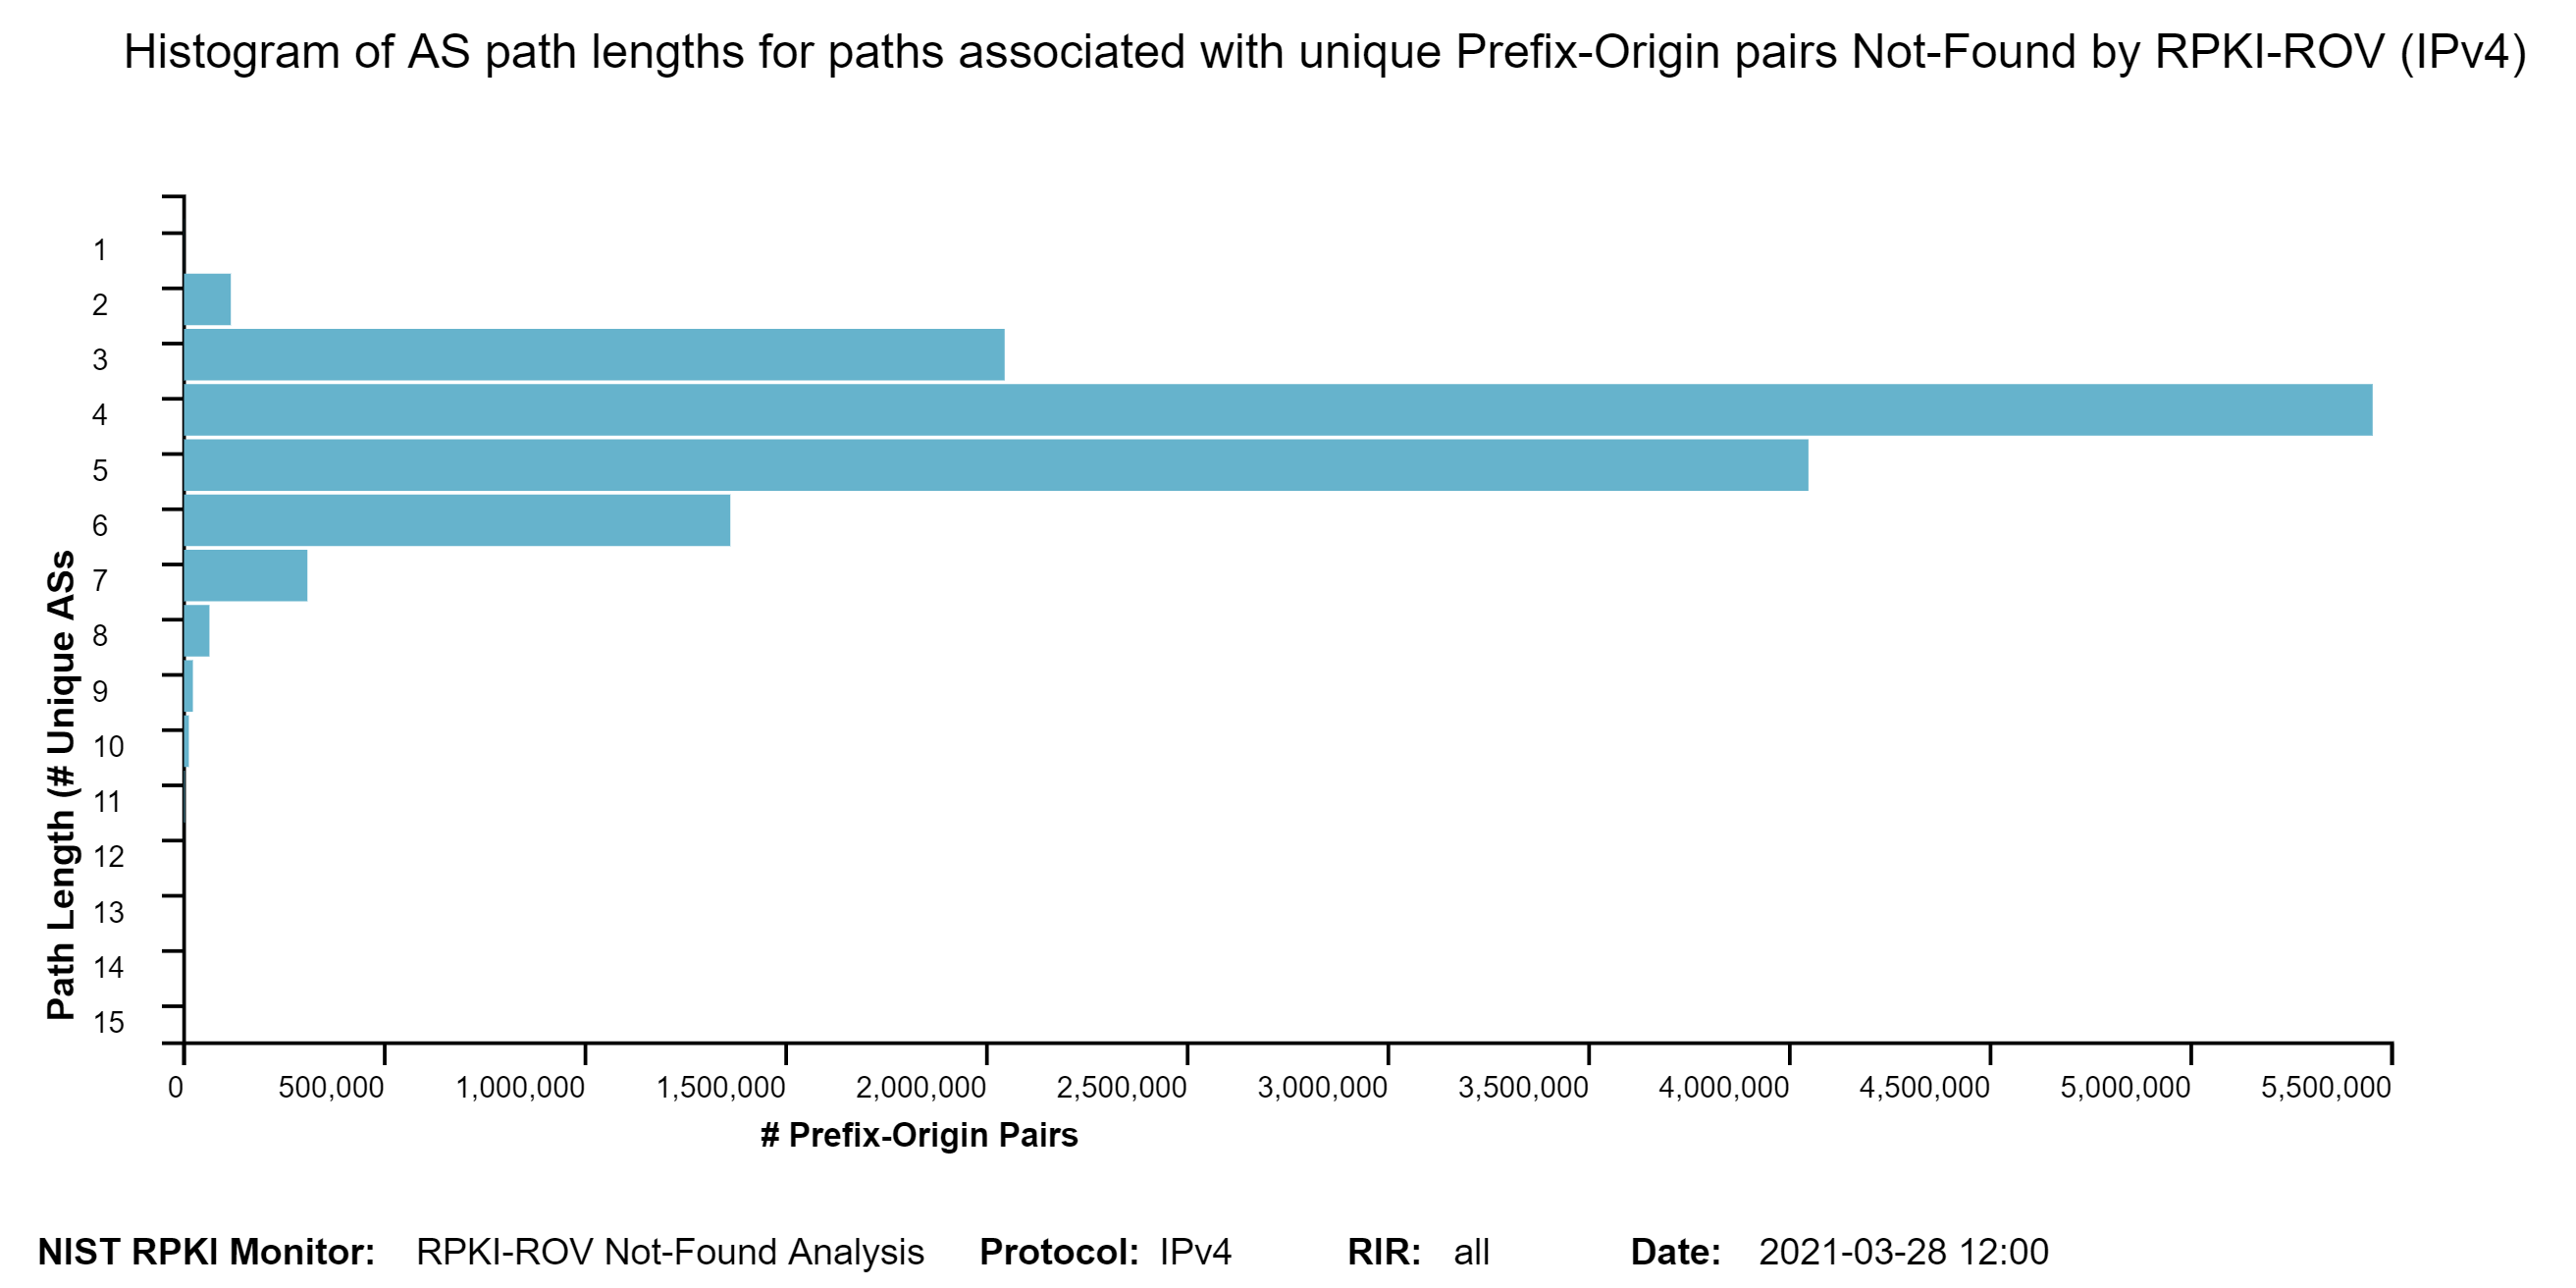
 The two graphs below show: (1) the histogram of prefix lengths in unique Prefix-Origin pairs that are NotFound by RPKI-ROV (IPv4), and (2) the histogram of AS path lengths for the paths associated with unique Prefix-Origin pairs that are NotFound by RPKI-ROV (IPv4). The vertical axis represents the prefix length and the AS path length in the two figures, respectively. The horizontal axis represents the number of unique Prefix-Origin pairs. Similar graphs are also available for IPv6 in the Monitor (jump to this analysis).
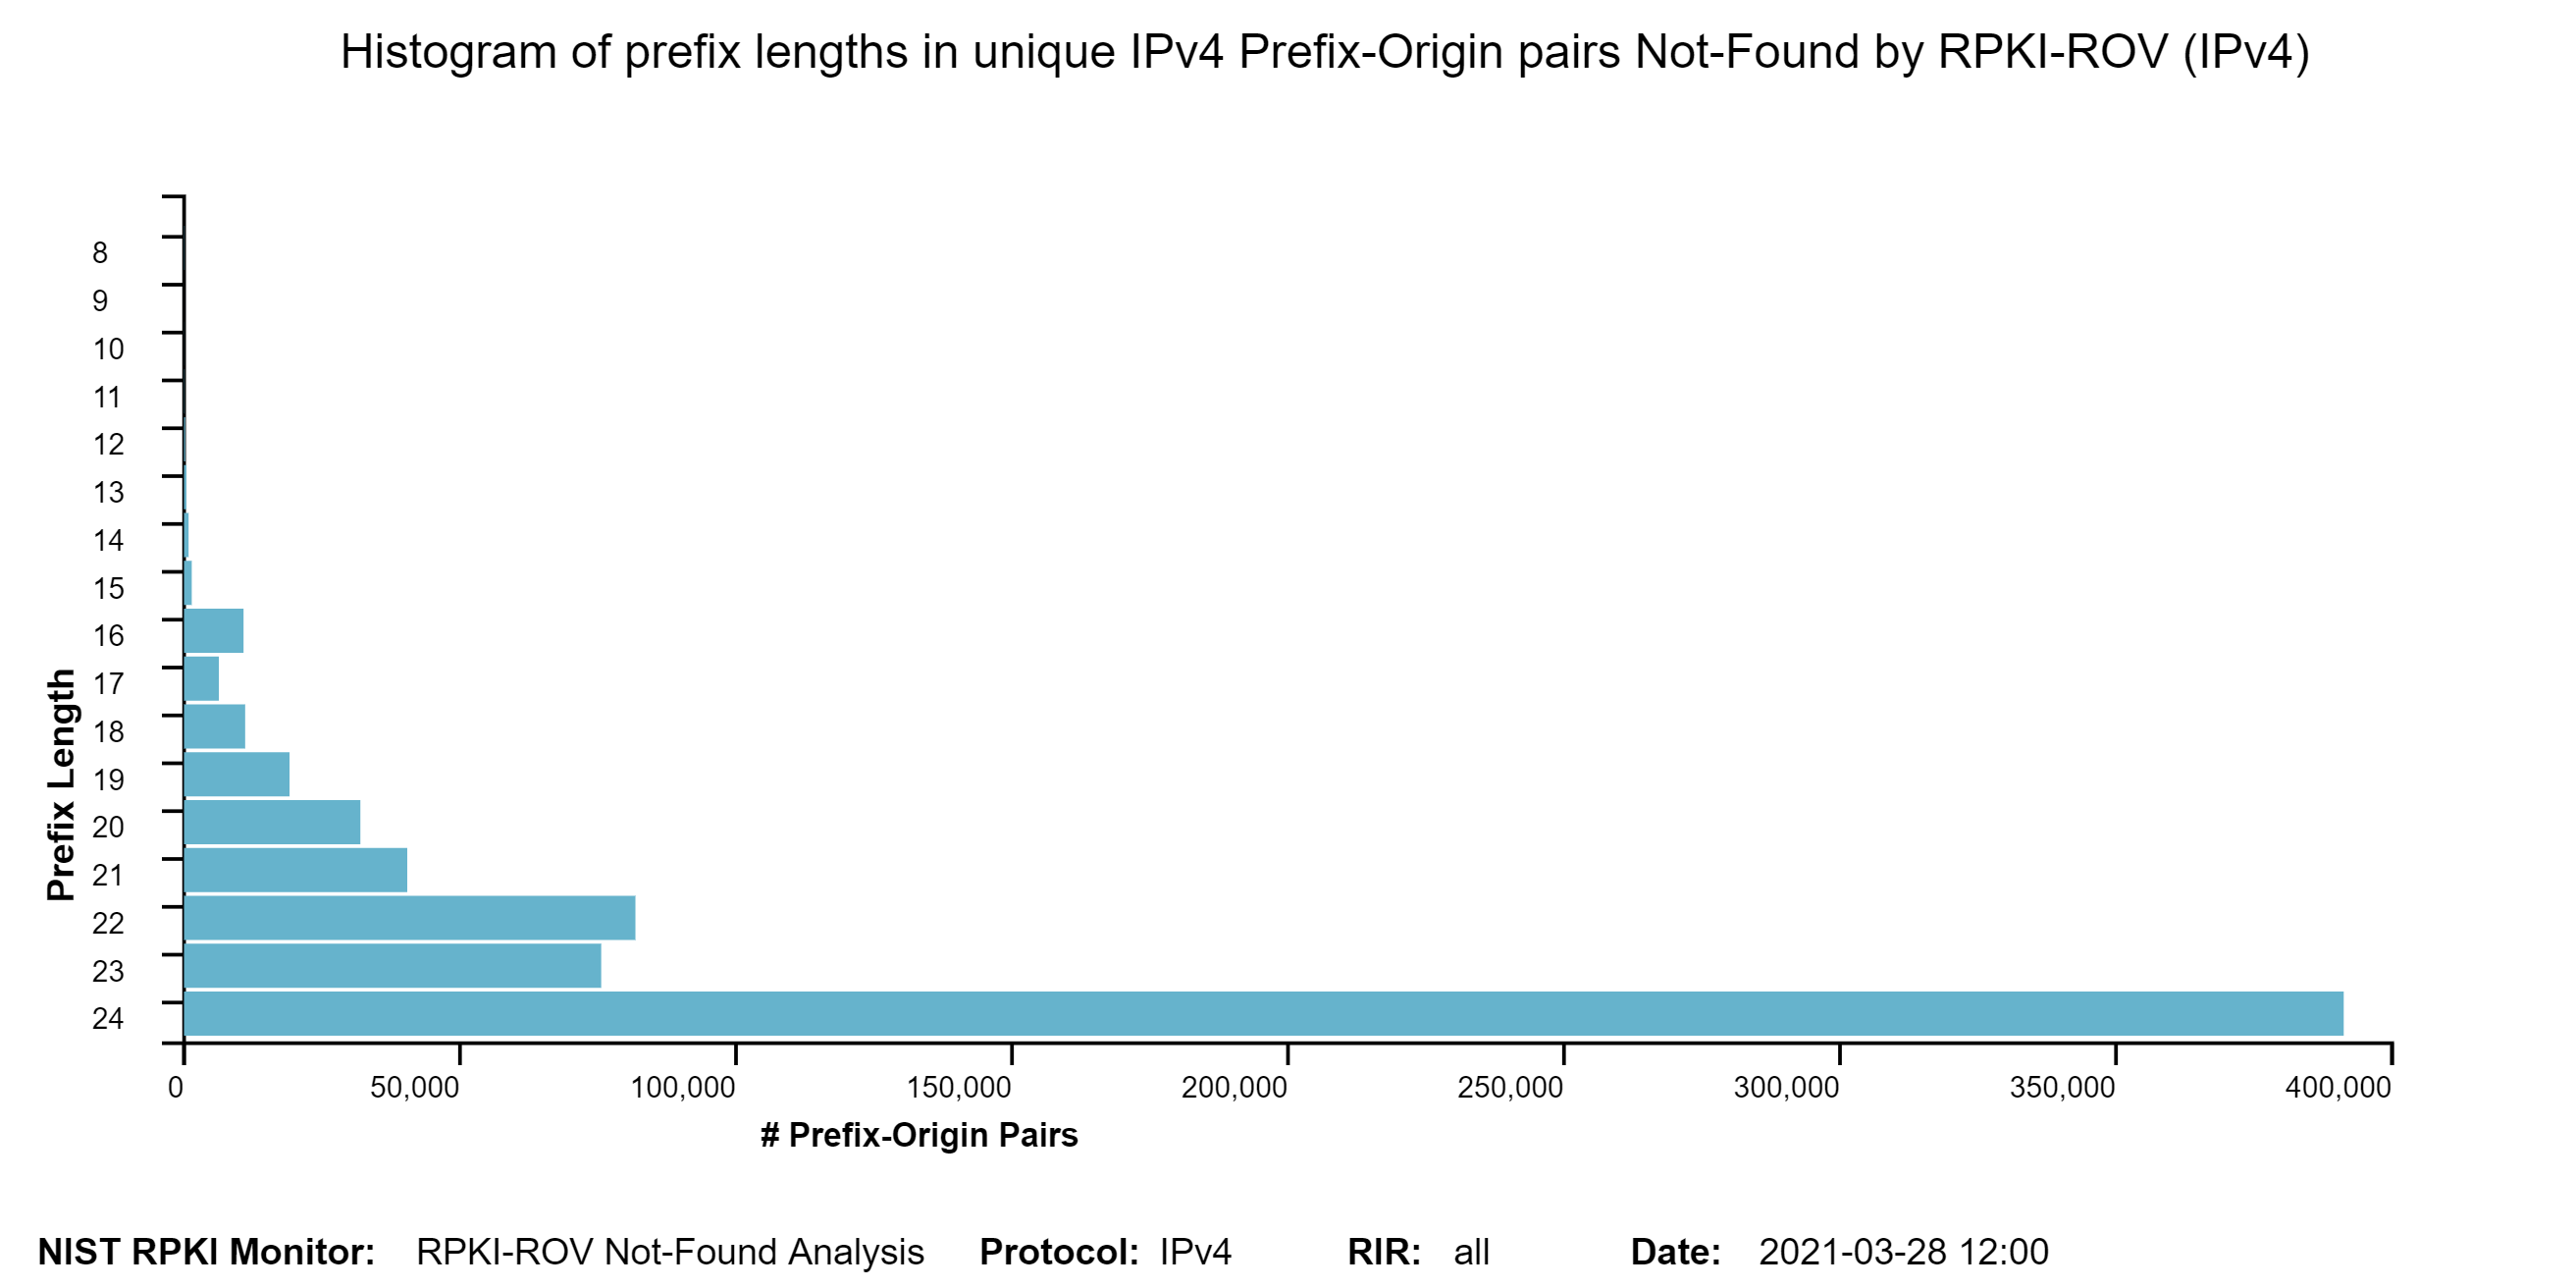
RPKI-ROV Analysis: Invalid Originations
To get a detailed view of Prefix-Origin pairs that are Invalid by RPKI-ROV, we provide a set of analyses along the dimensions of top 25 organizations, prefix length, AS path length, and the type of Invalid.
The Invalid [RFC 6811][Fig. 7, NIST SP 800-189] Prefix-Origin pairs are further classified into the following four different categories [RFC 6907, Section 7.1]:
- Invalid:AS Covering ROA Prefix, max-Length Satisfied, and AS Mismatch.
- Invalid:ML Covering ROA Prefix, max-Length Exceeded, and AS Match.
- Invalid:ML-AS Covering ROA Prefix, max-Length Exceeded, and AS Mismatch.
- Invalid:AS-SET The origin AS could not be determined from the BGP update used to announce the prefix (i.e., because it contains an AS-SET), and a ROA covering the prefix exists.
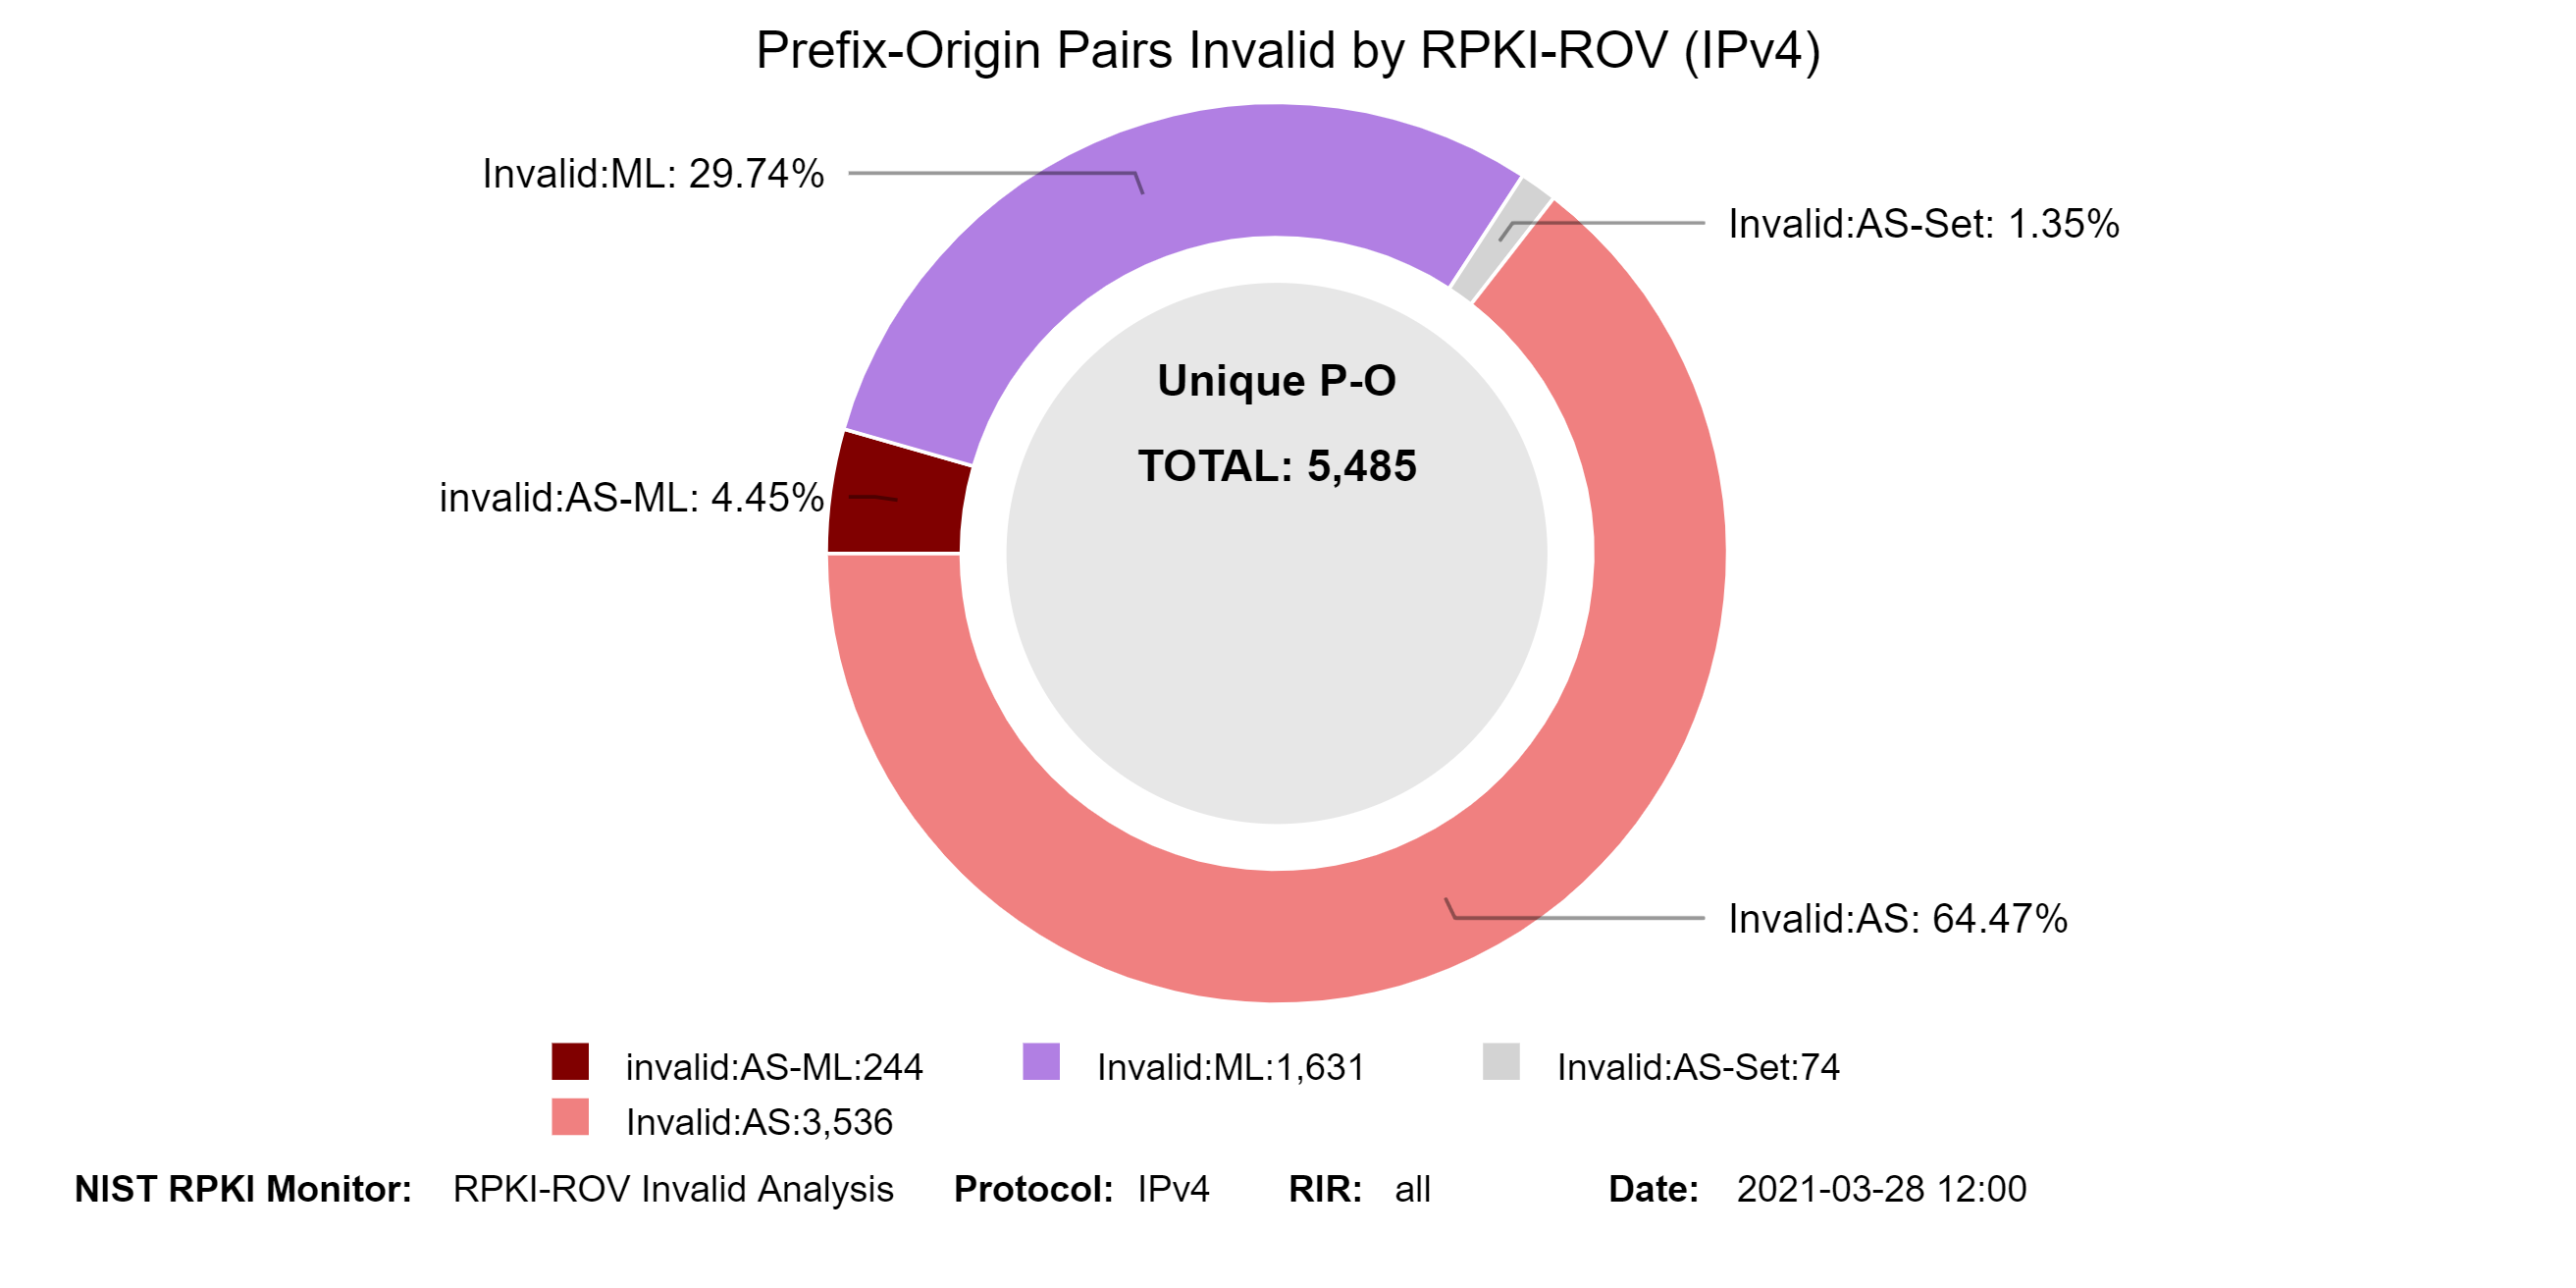
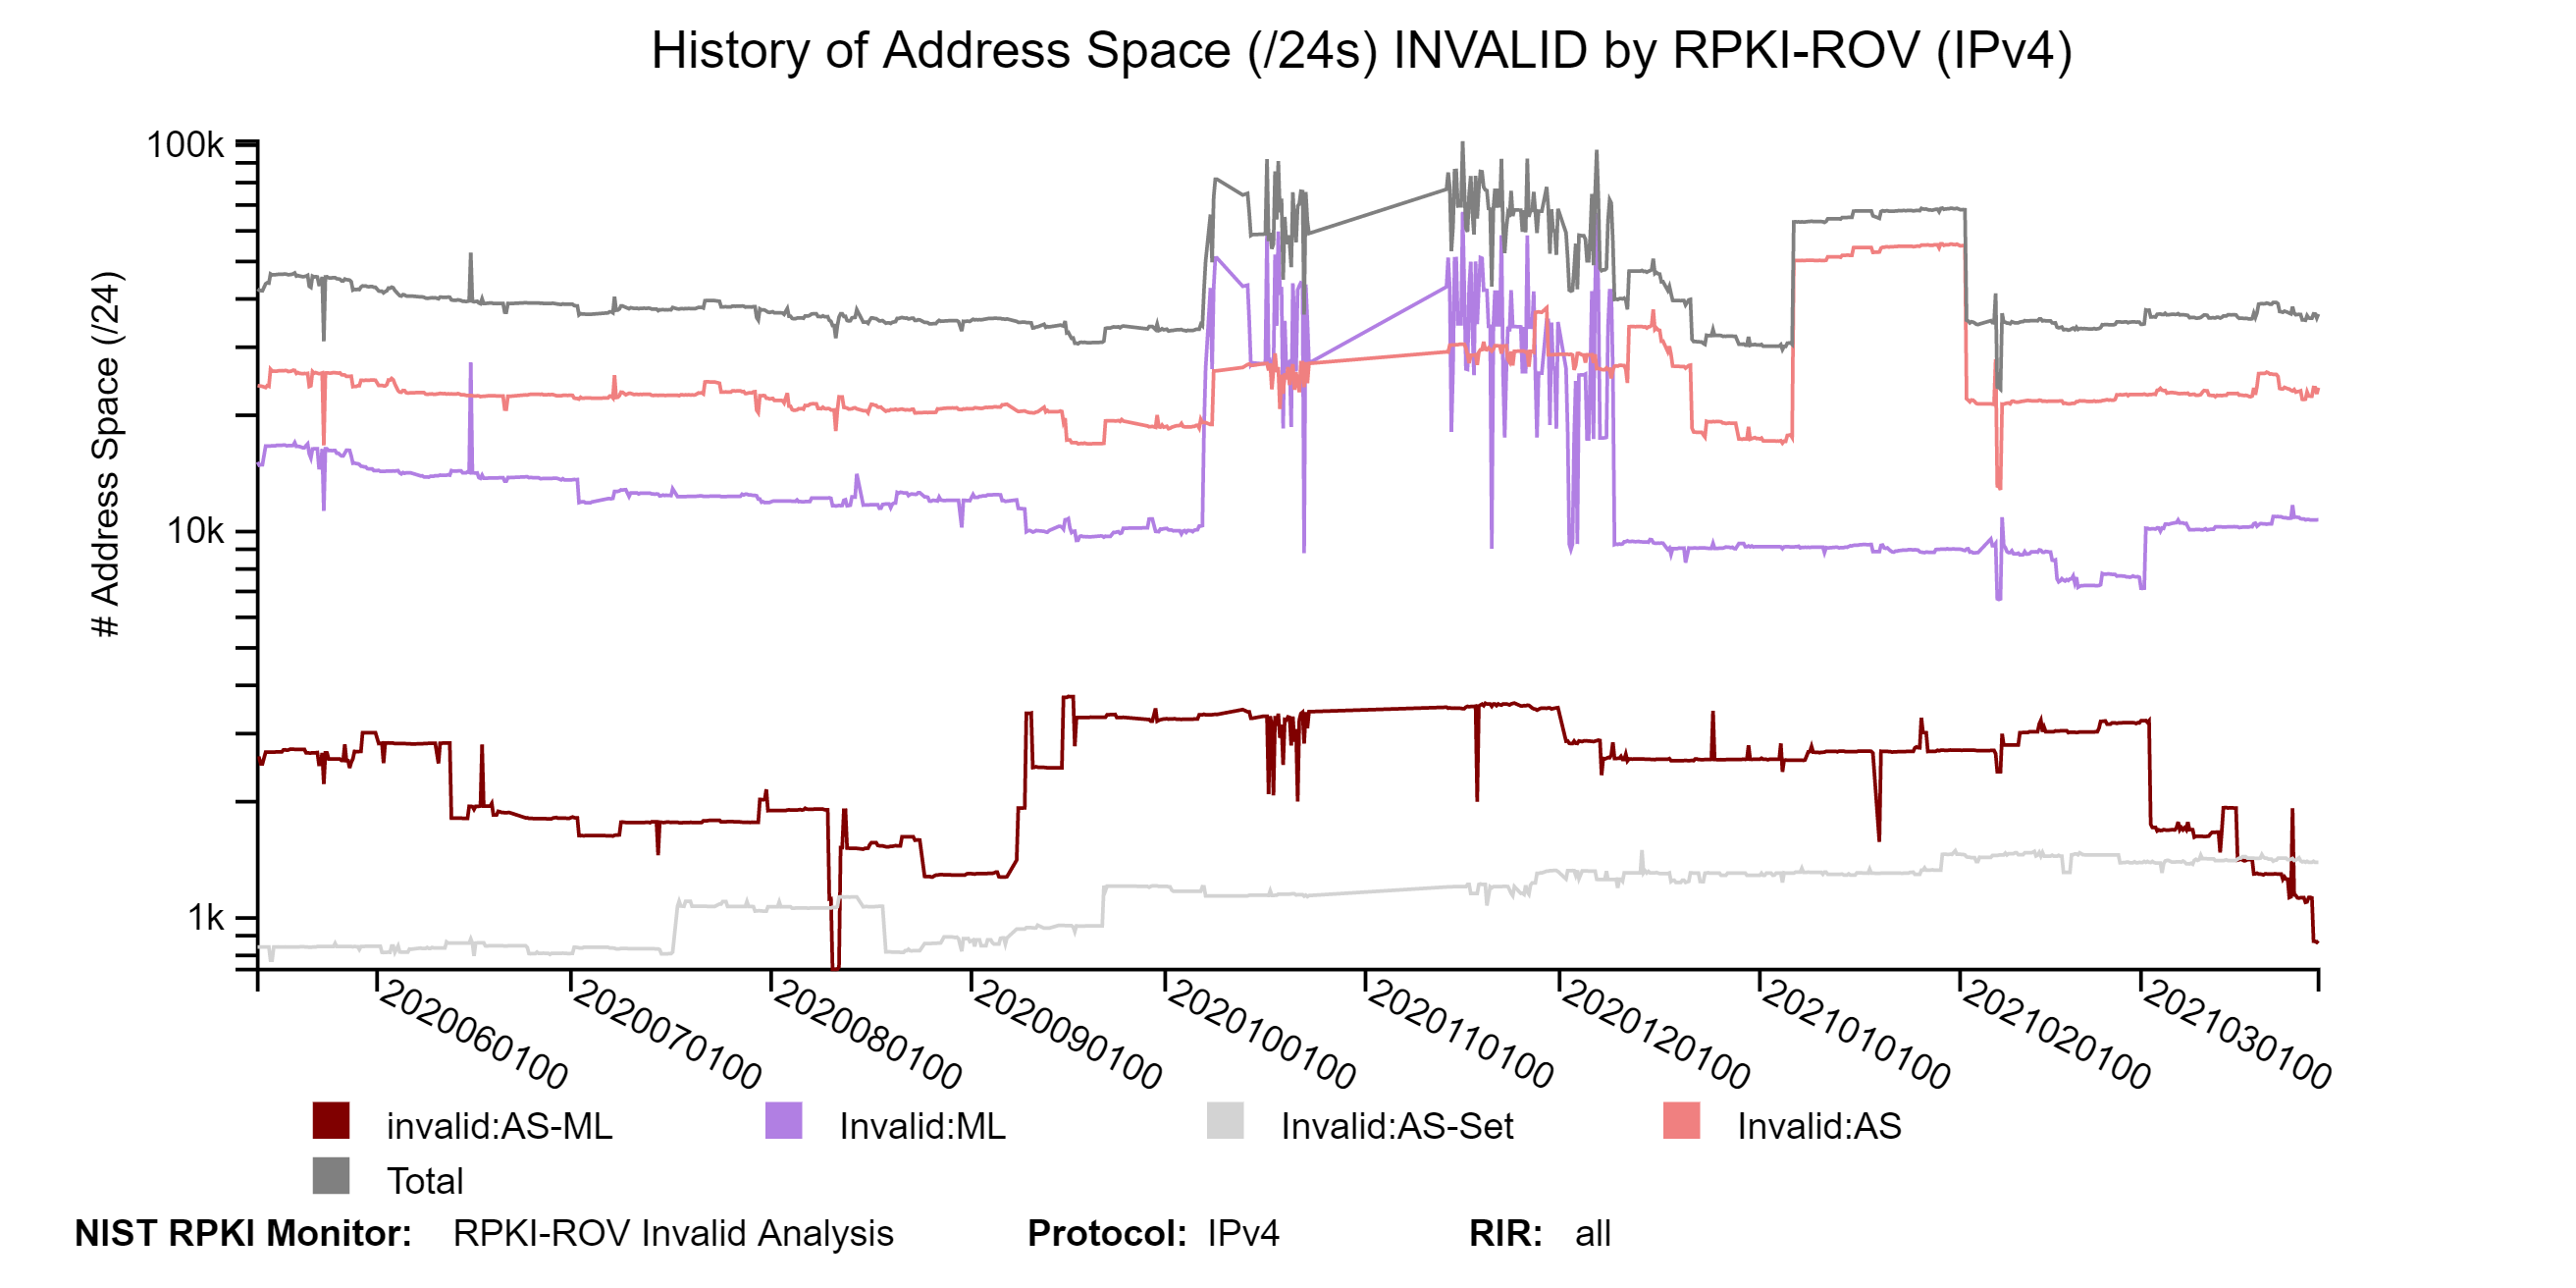
 The graphs below show the history of the details of Invalid unique Prefix-Origin pairs for IPv4 and IPv6 (with a breakdown in terms of the four types of Invalid) (jump to this analysis).
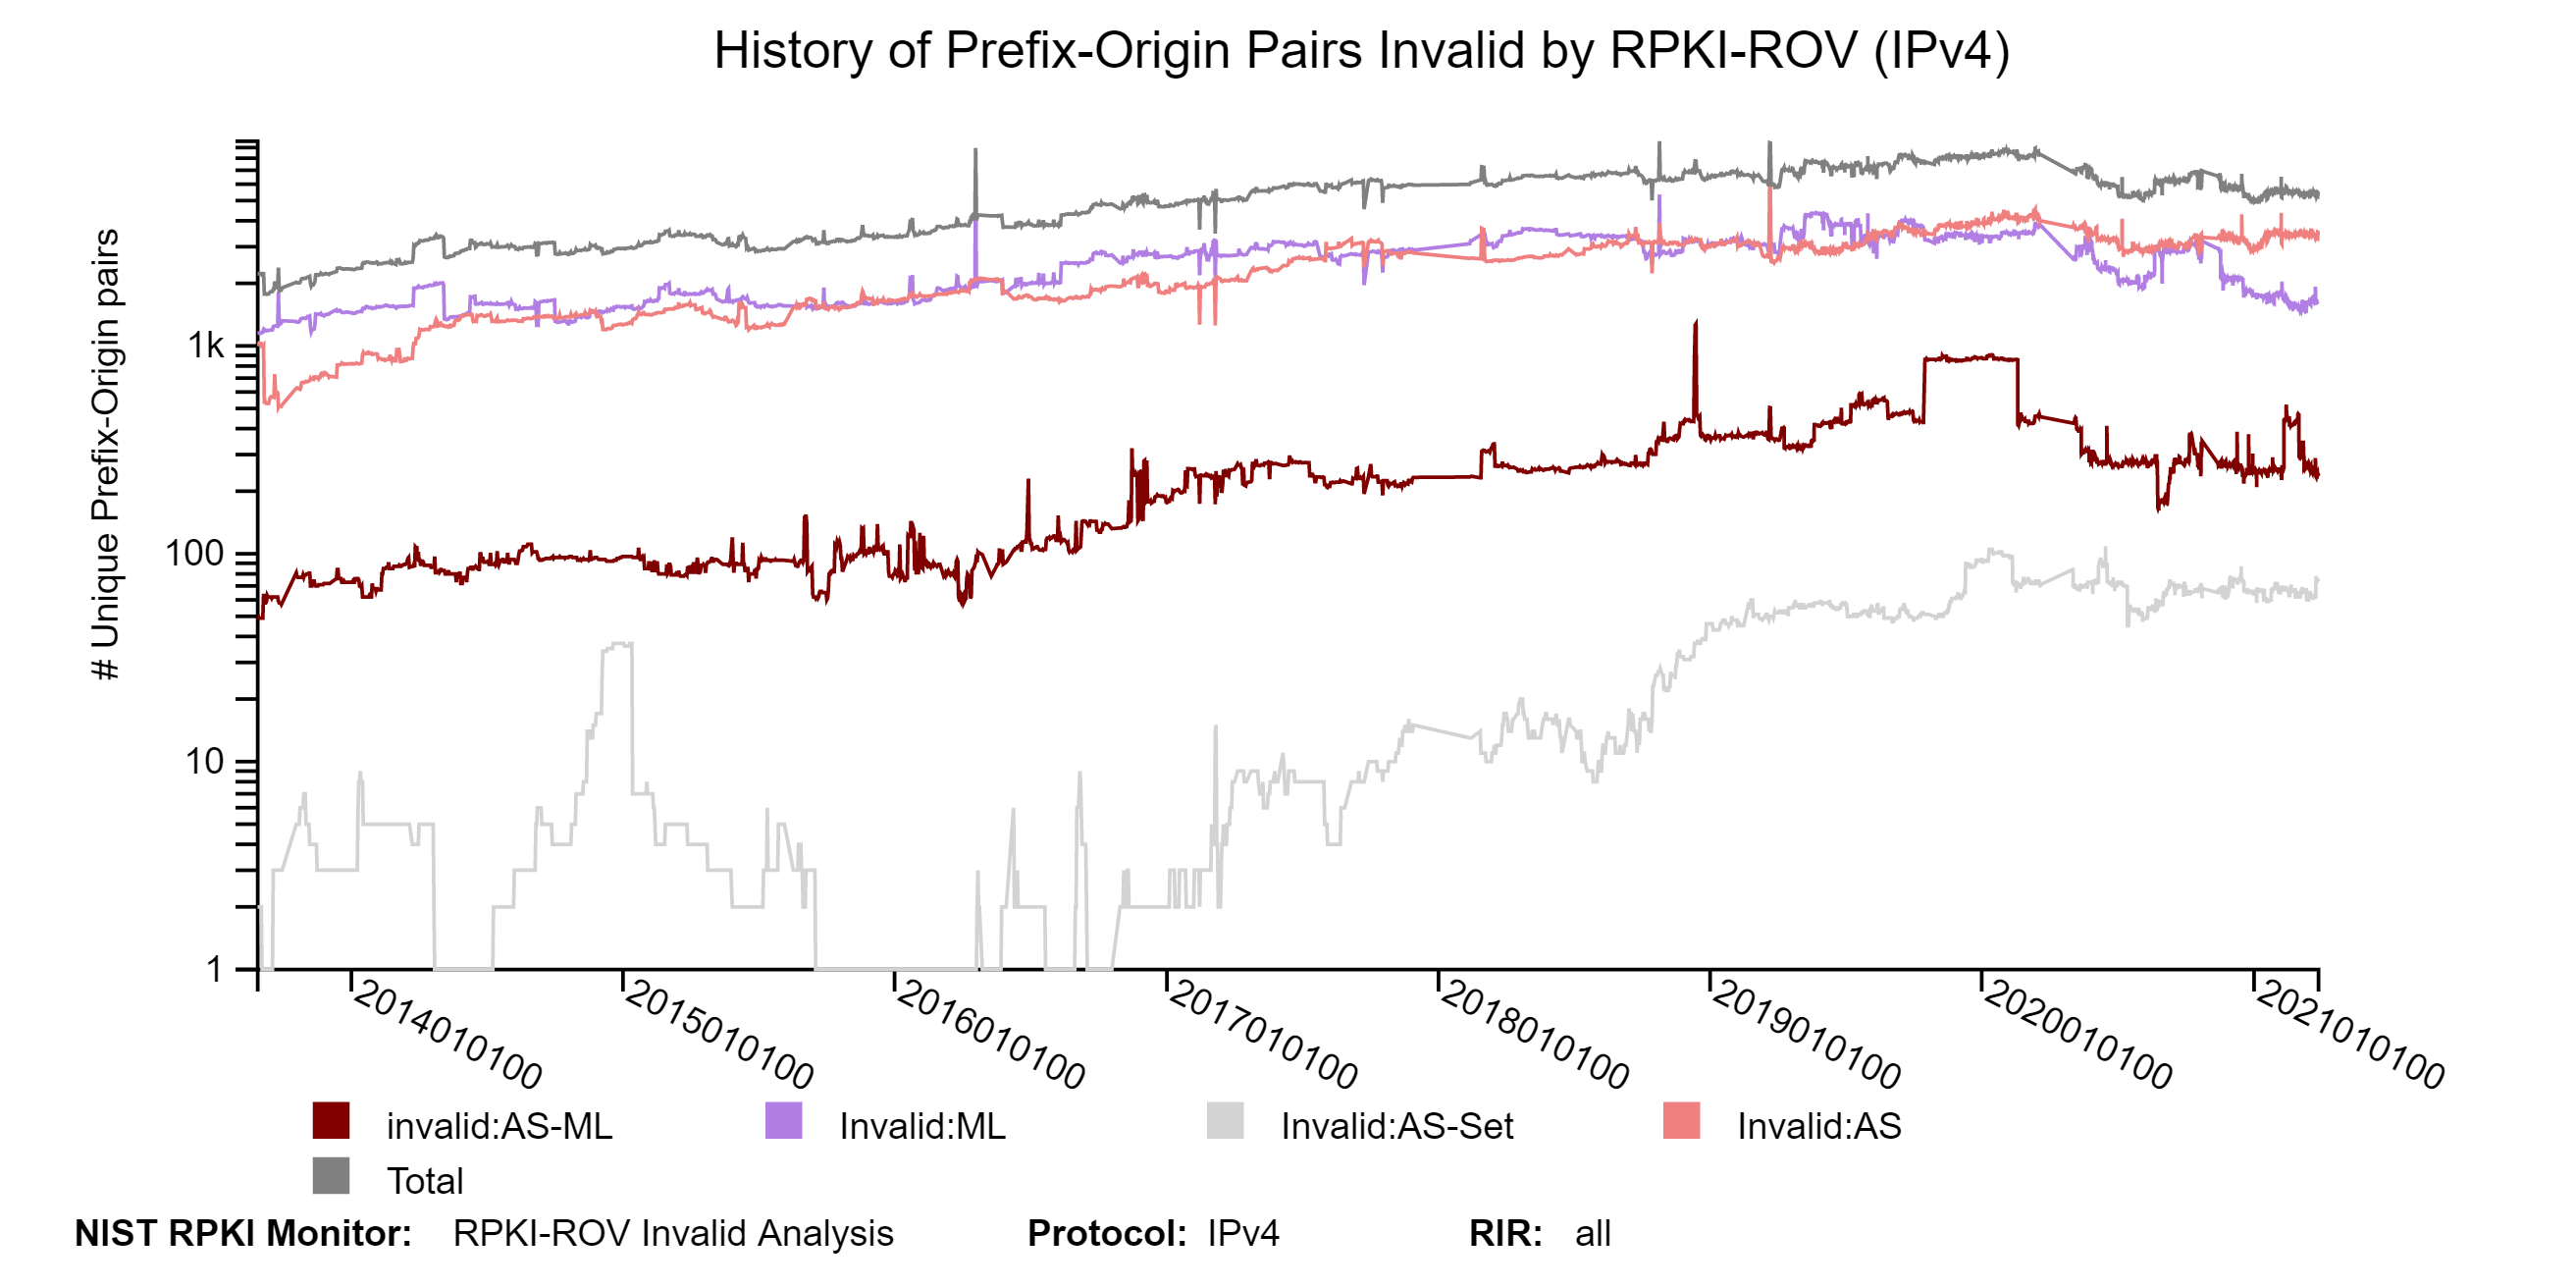
The graph below represents a snapshot of the details of the Invalid address space (in /24s) for IPv4. They show the breakdown in terms of the four types of Invalid. The second graph below shows the history of the details of the Invalid address space (in /24s) for IPv4 (jump to this analysis).
The two graphs below depict the top 25 Autonomous Systems (ASes) with the most BGP observed IPv4 prefixes Invalid by RPKI-ROV and the top 25 ASes with the most IPv4 Address Space (/24s) Invalid by RPKI-ROV. The organization names of the ASes are shown on the y-axis next to the AS numbers (ASNs). The IPv6 version of the first of these graphs is also available in the Monitor (jump to this analysis).
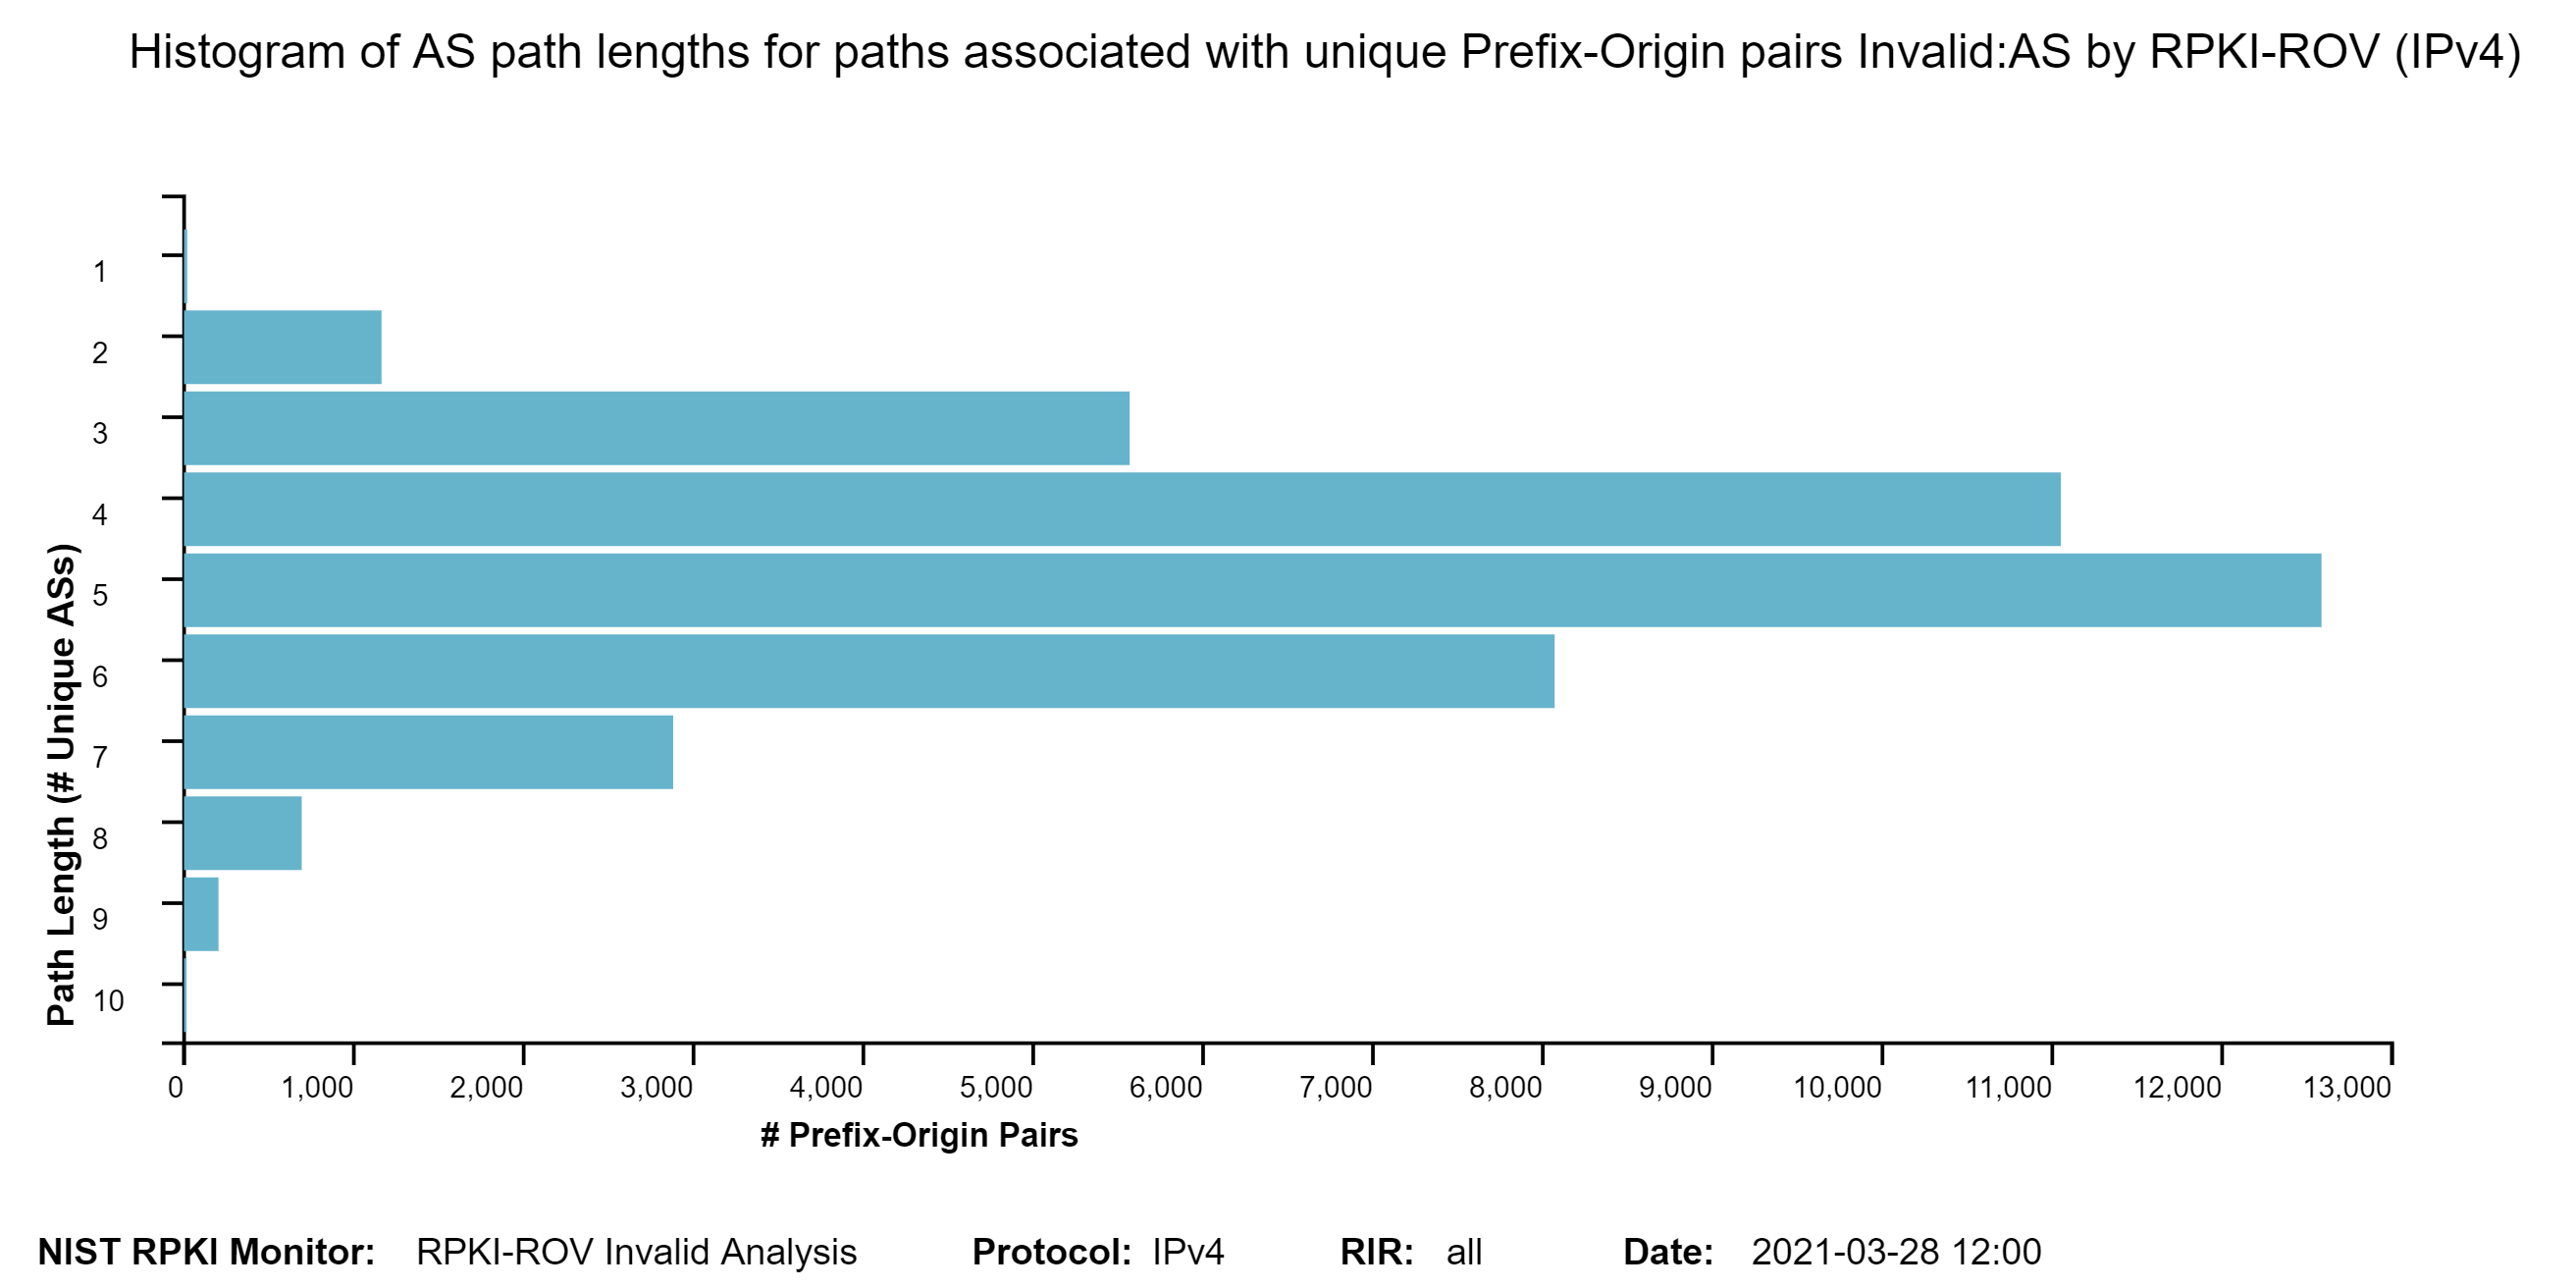
The two graphs below show: (1) the histogram of prefix lengths in unique Prefix-Origin pairs that are Invalid:AS by RPKI-ROV (IPv4), and (2) the histogram of AS path lengths for the paths associated with unique Prefix-Origin pairs that are Invalid:AS by RPKI-ROV (IPv4). The vertical axis represents the prefix length and the AS path length in the two figures, respectively. The horizontal axis represents the number of unique Prefix-Origin pairs. The IPv6 versions of these graphs are also available in the Monitor. The Monitor also shows the versions of these graphs for the other two cases of Invalid by RPKI-ROV, namely, Invalid:ML and Invalid:AS&ML (jump to this analysis).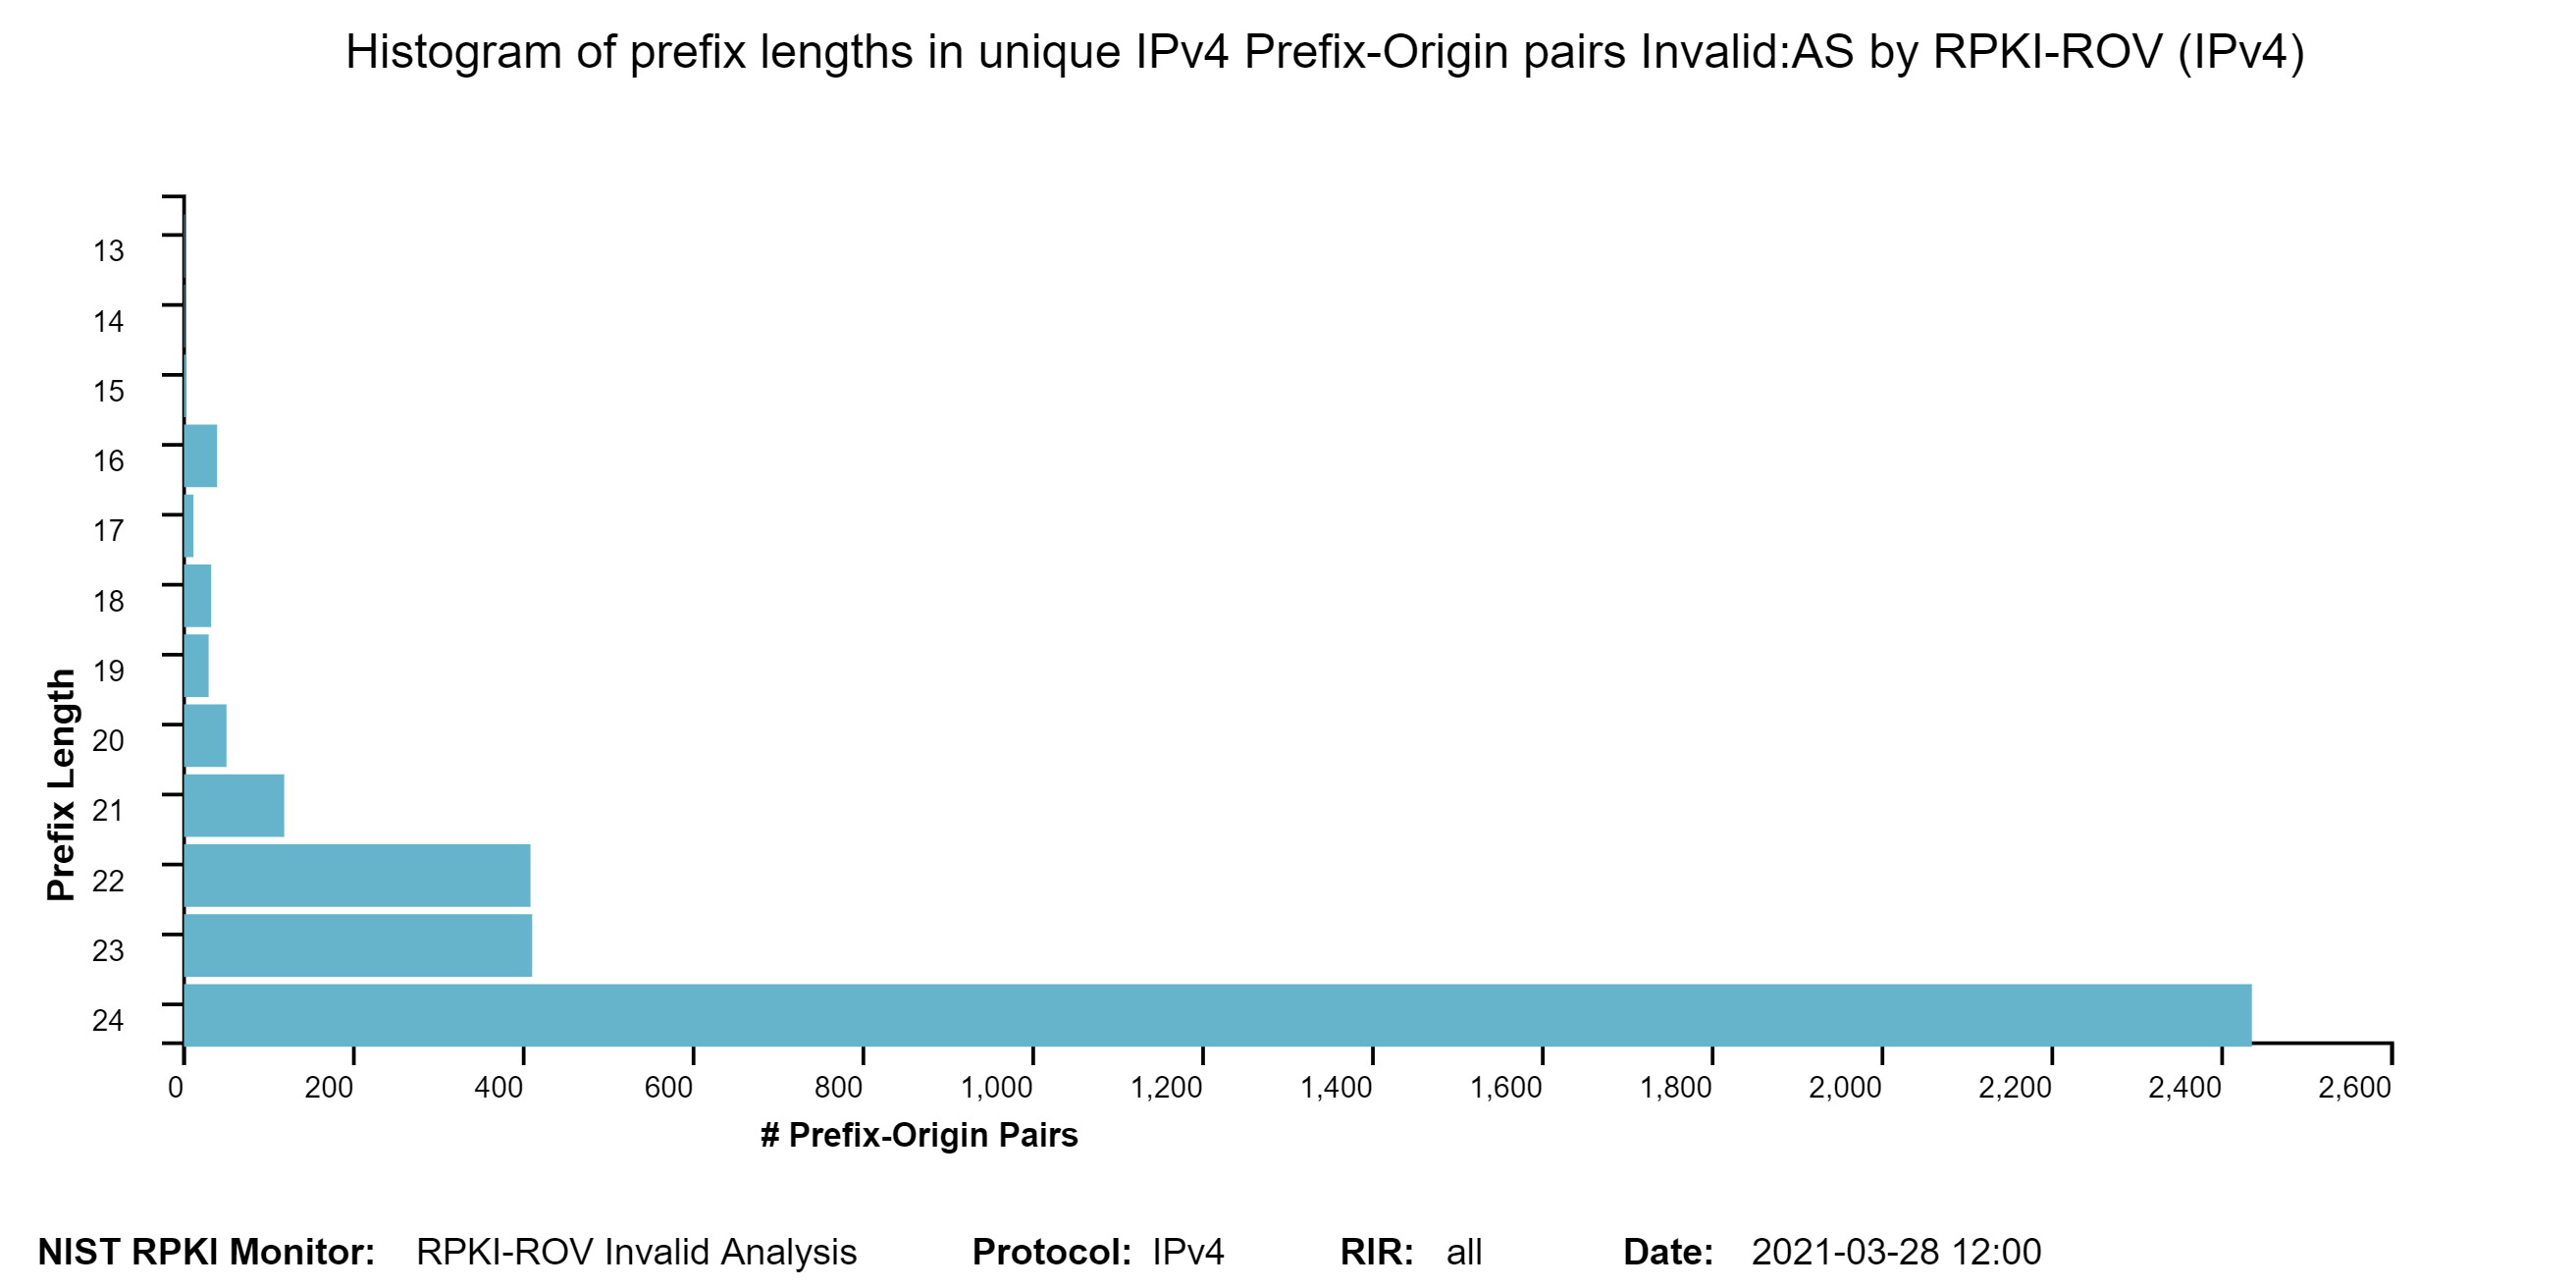
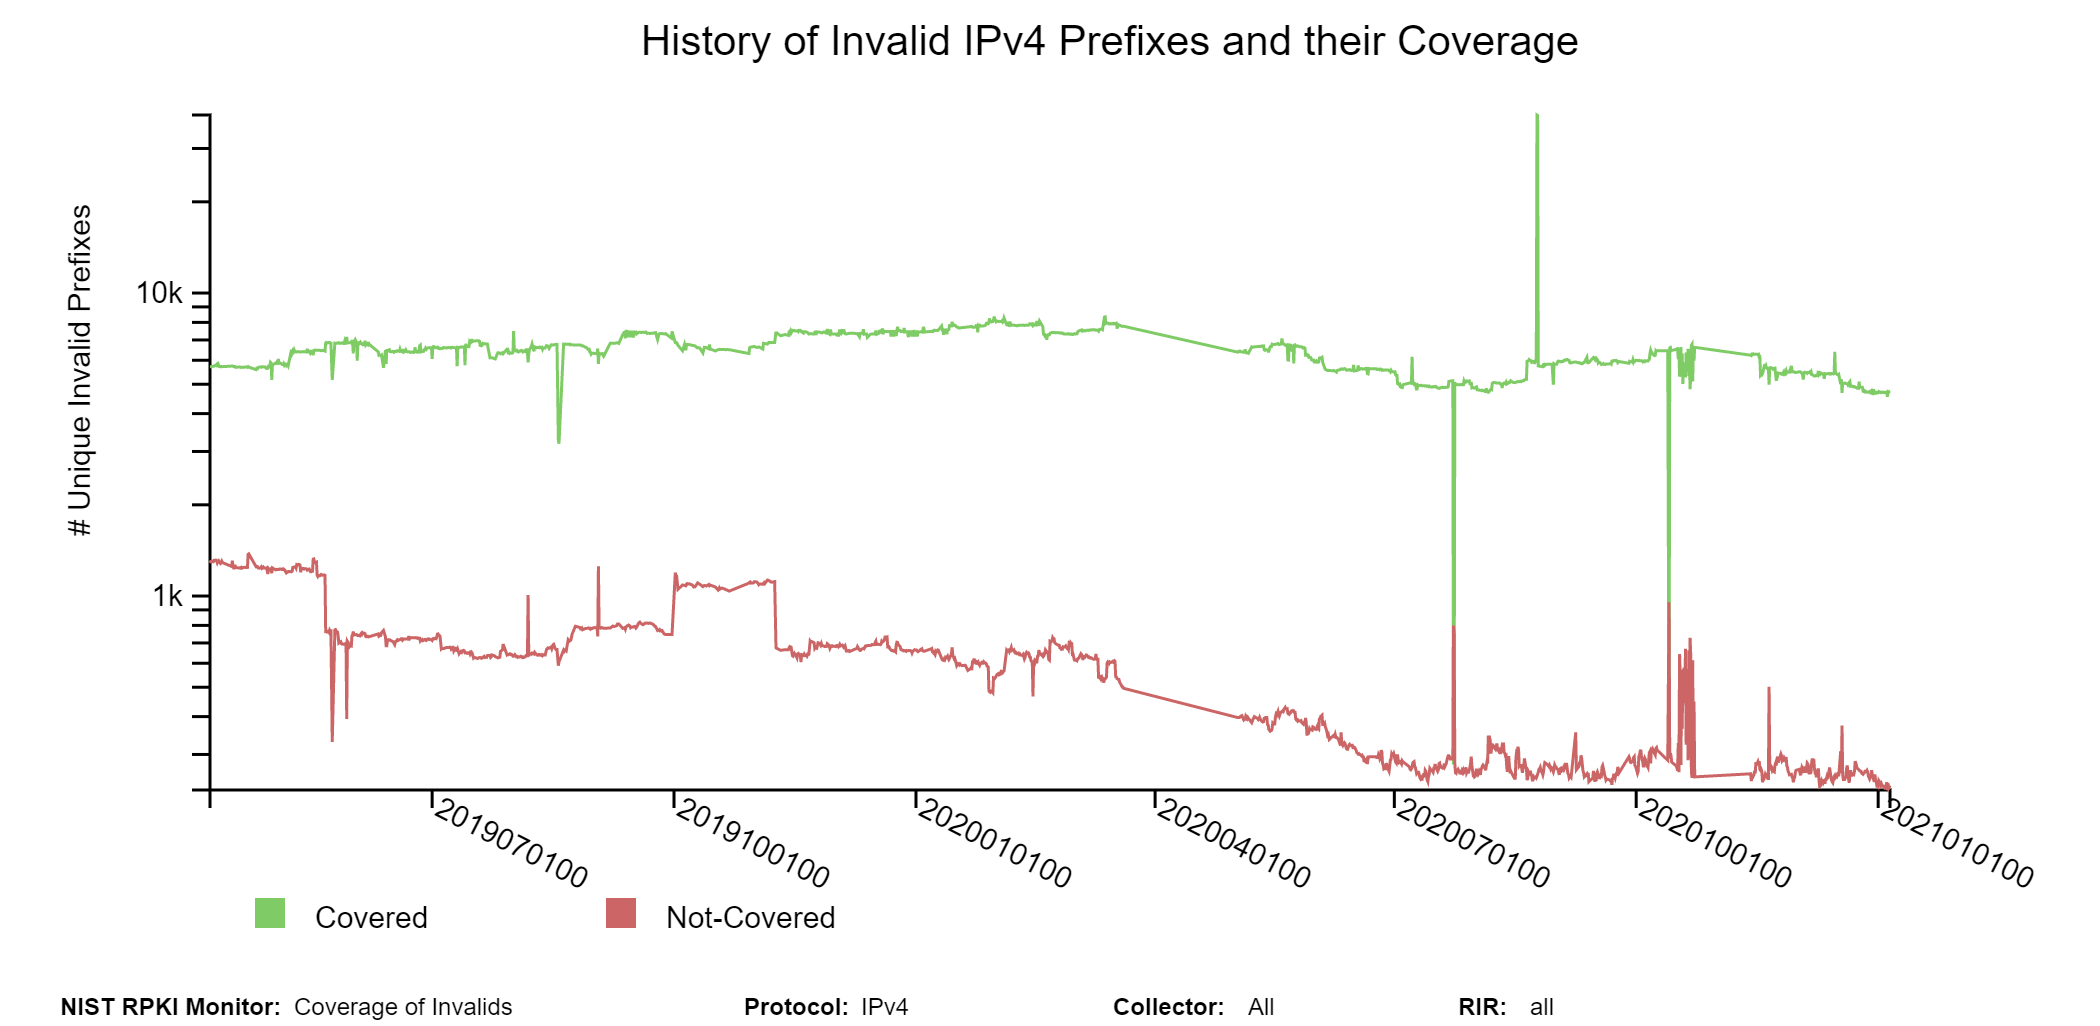
In this part, the coverage analysis of Invalid routes is provided. Coverage of Invalid routes means that there are Valid or Not-Found alternate routes to be found with the same prefix (as the Invalid) or a less specific prefix encompassing the Invalid prefix. Only the unique prefixes are selected from all unique Invalid Prefix-Origin pairs, and they are called unique Invalid prefixes. To identify the covering route for an Invalid prefix, all covering Valid/Not-Found routes are listed and then the most specific among them is considered the applicable covering route. The coverage is analyzed along various dimensions in terms of the characteristics of the covering route relative to that of the Invalid route. These characteristics include: (a) whether the covering route is Valid or Not-Found; (b) whether the covering route has the same or different AS path; (c) whether it has the same or different origin AS; and (d) whether it has the same or different next-hop peer. The latter two are applicable only in the case of a covering route having a different AS path. The subsections (tabs in the Monitor) are as follows.
| All Invalid Originations | Displays a global view of Coverage of Invalid routes. |
|---|---|
| Coverage Details | Displays coverage of Invalid routes with details in terms of the relative AS path characteristics of the covering route. |
| Coverage-Validation | Displays coverage of Invalid routes in terms of validation state (Valid/Not-Found) of the covering route. |
| Coverage-Region | Displays coverage of Invalid routes per Regional Internet Registry (RIR). |
| Invalid Prefix-Origin Pairs | The user can query for a list of Invalid Prefix-Origin pairs (with coverage details) per RIR, per Origin AS, etc. Clicking the green YES box in the “Covered (Click YES for details)” column gives the details of Covering routes. |
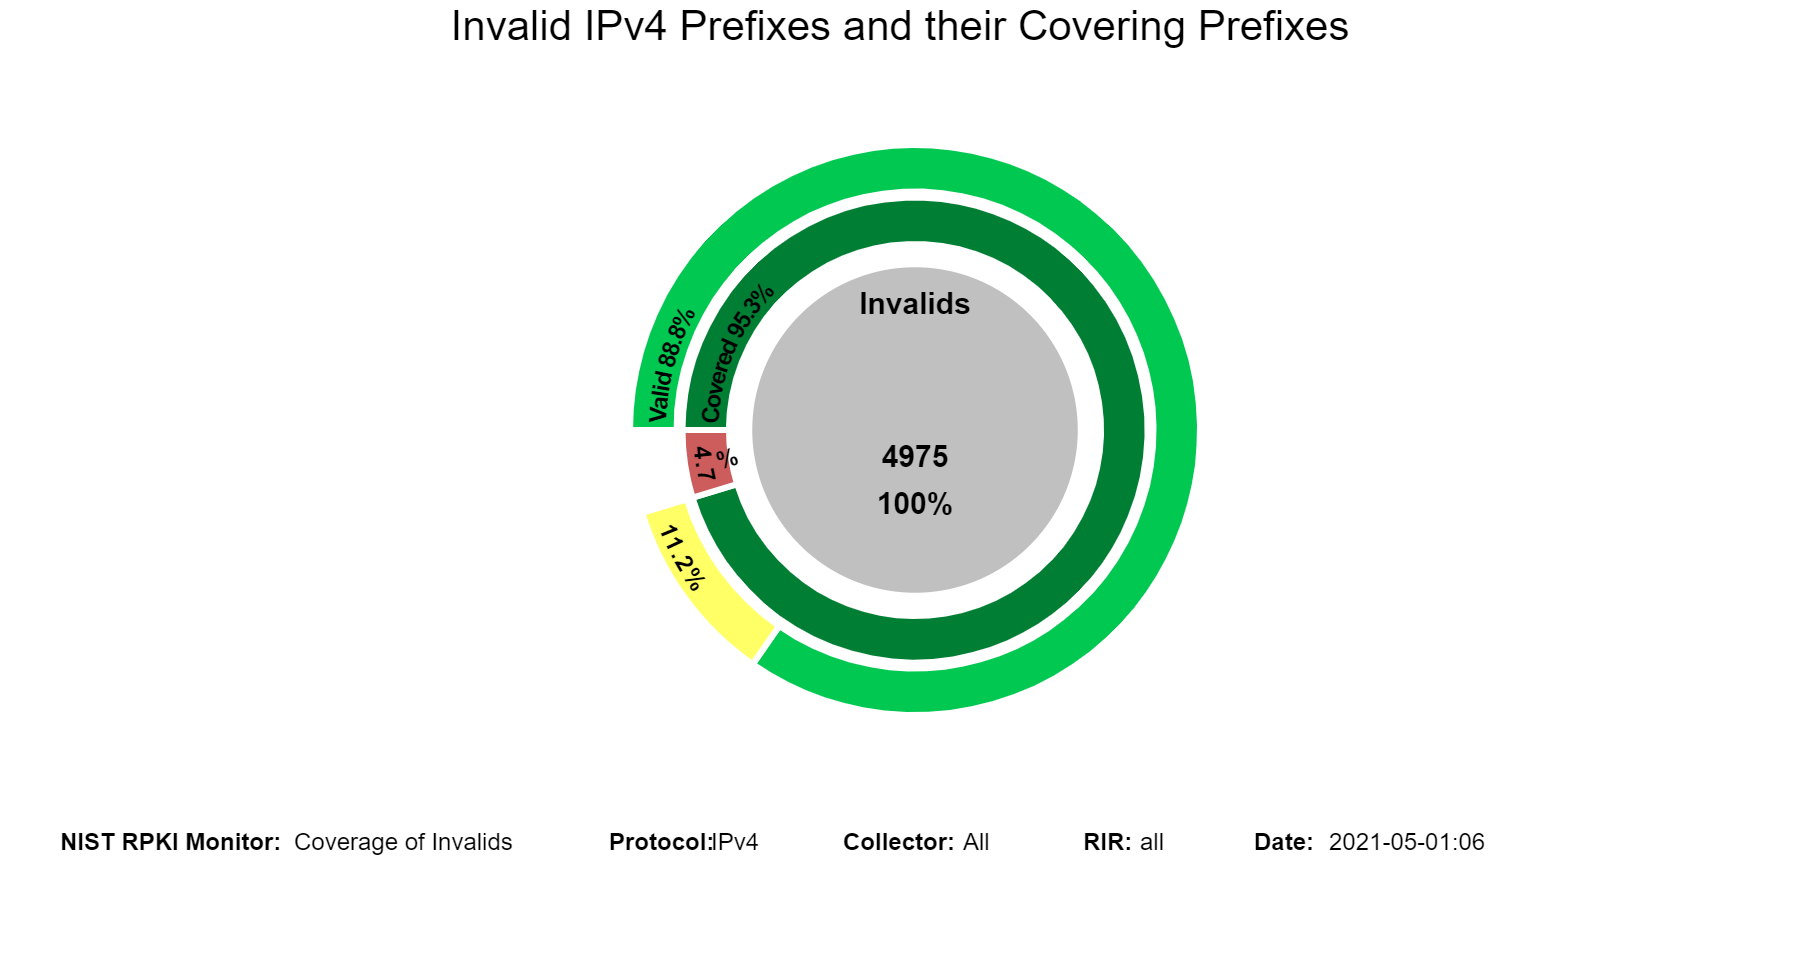
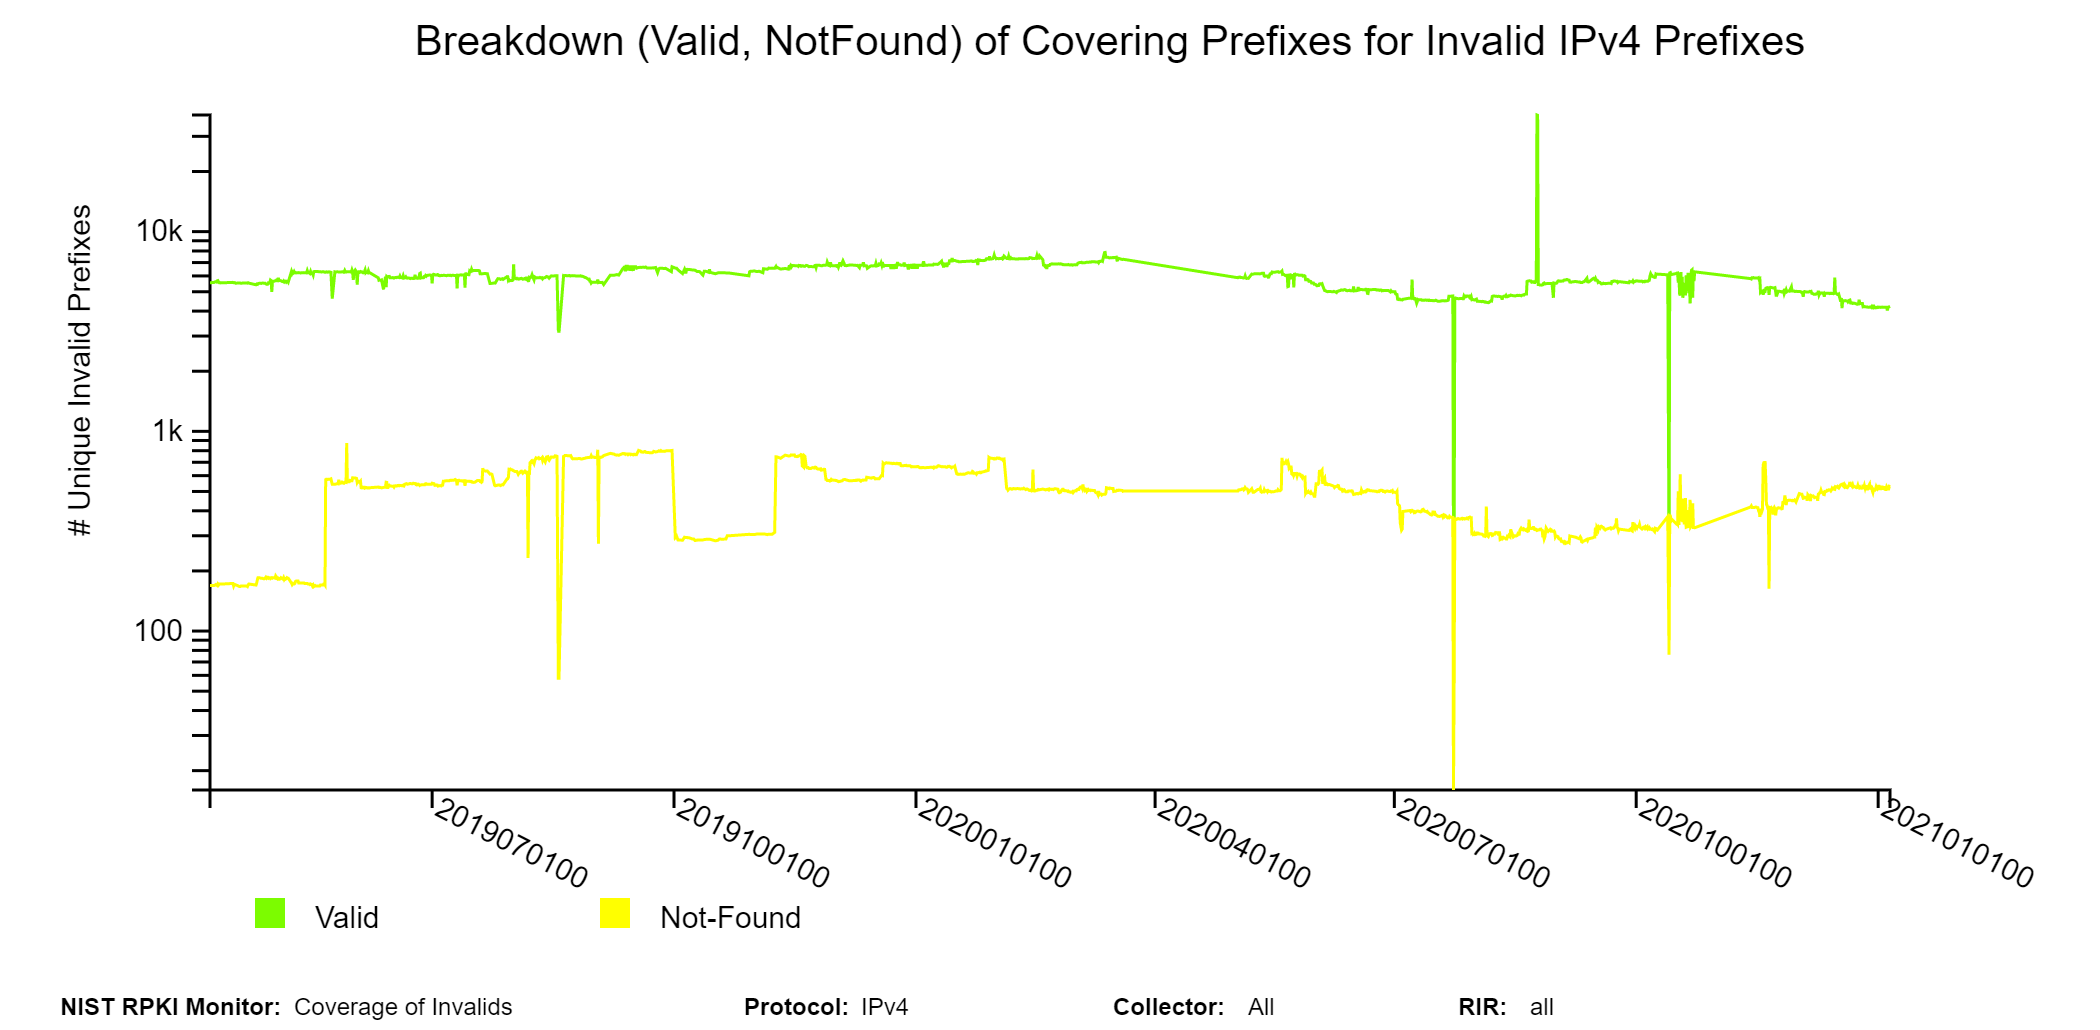
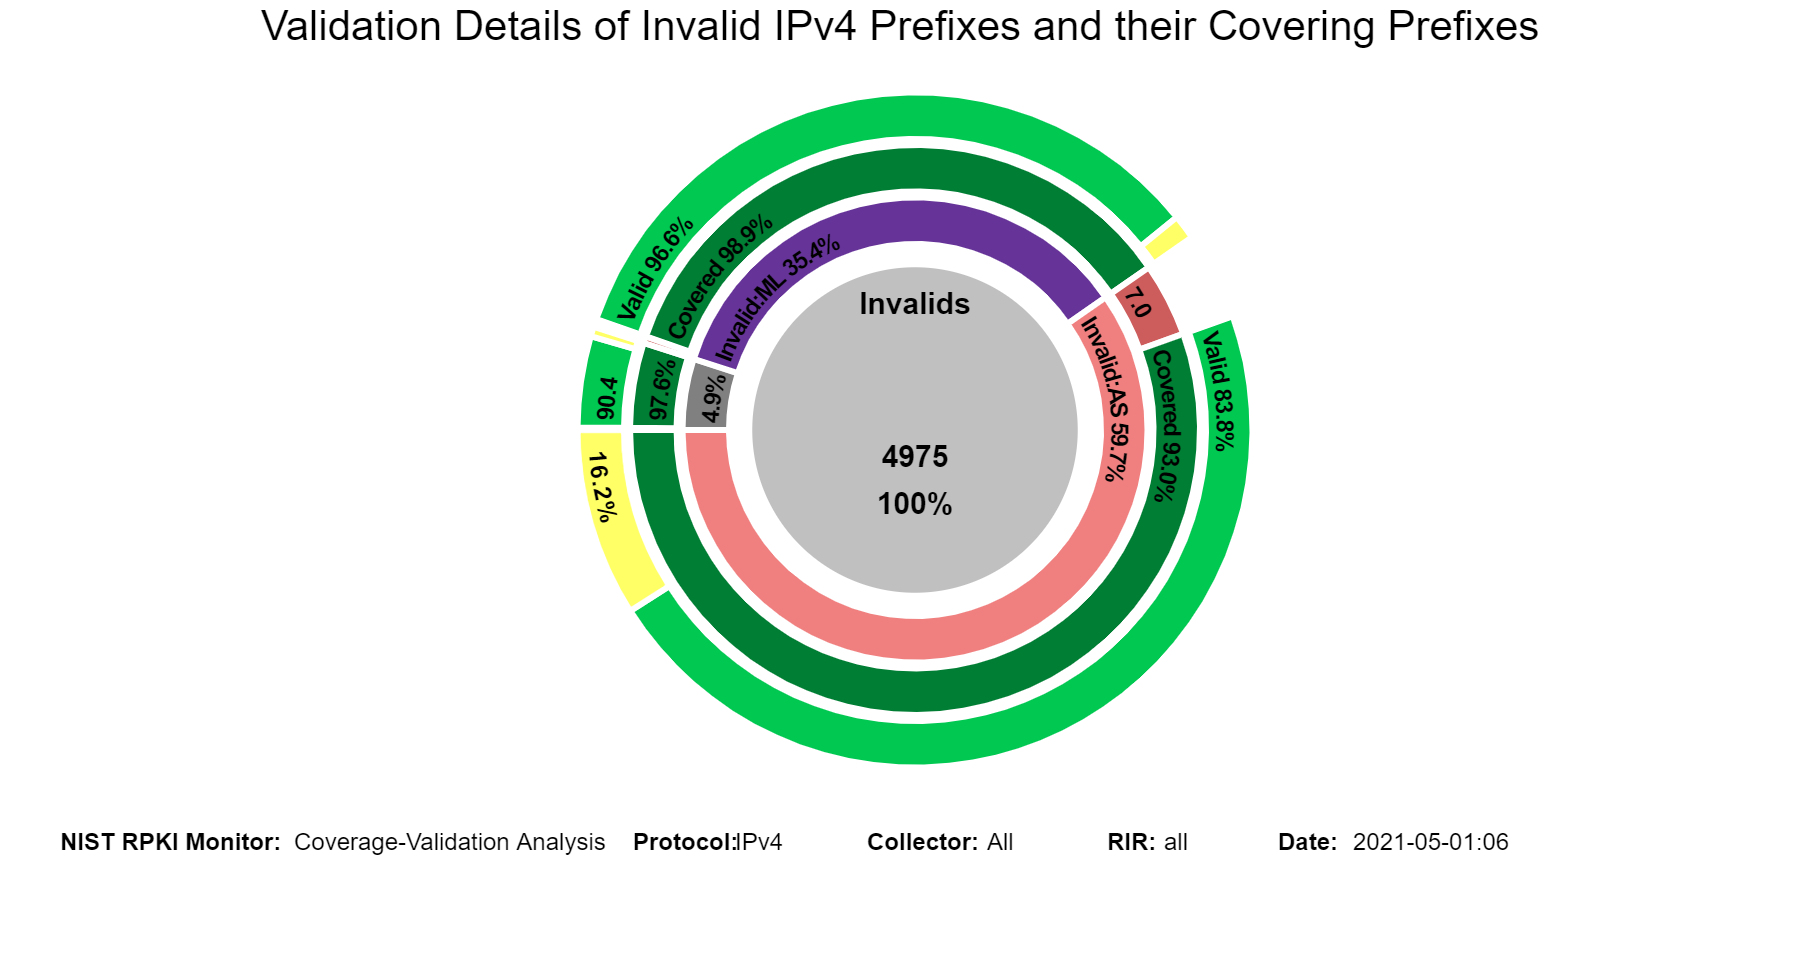
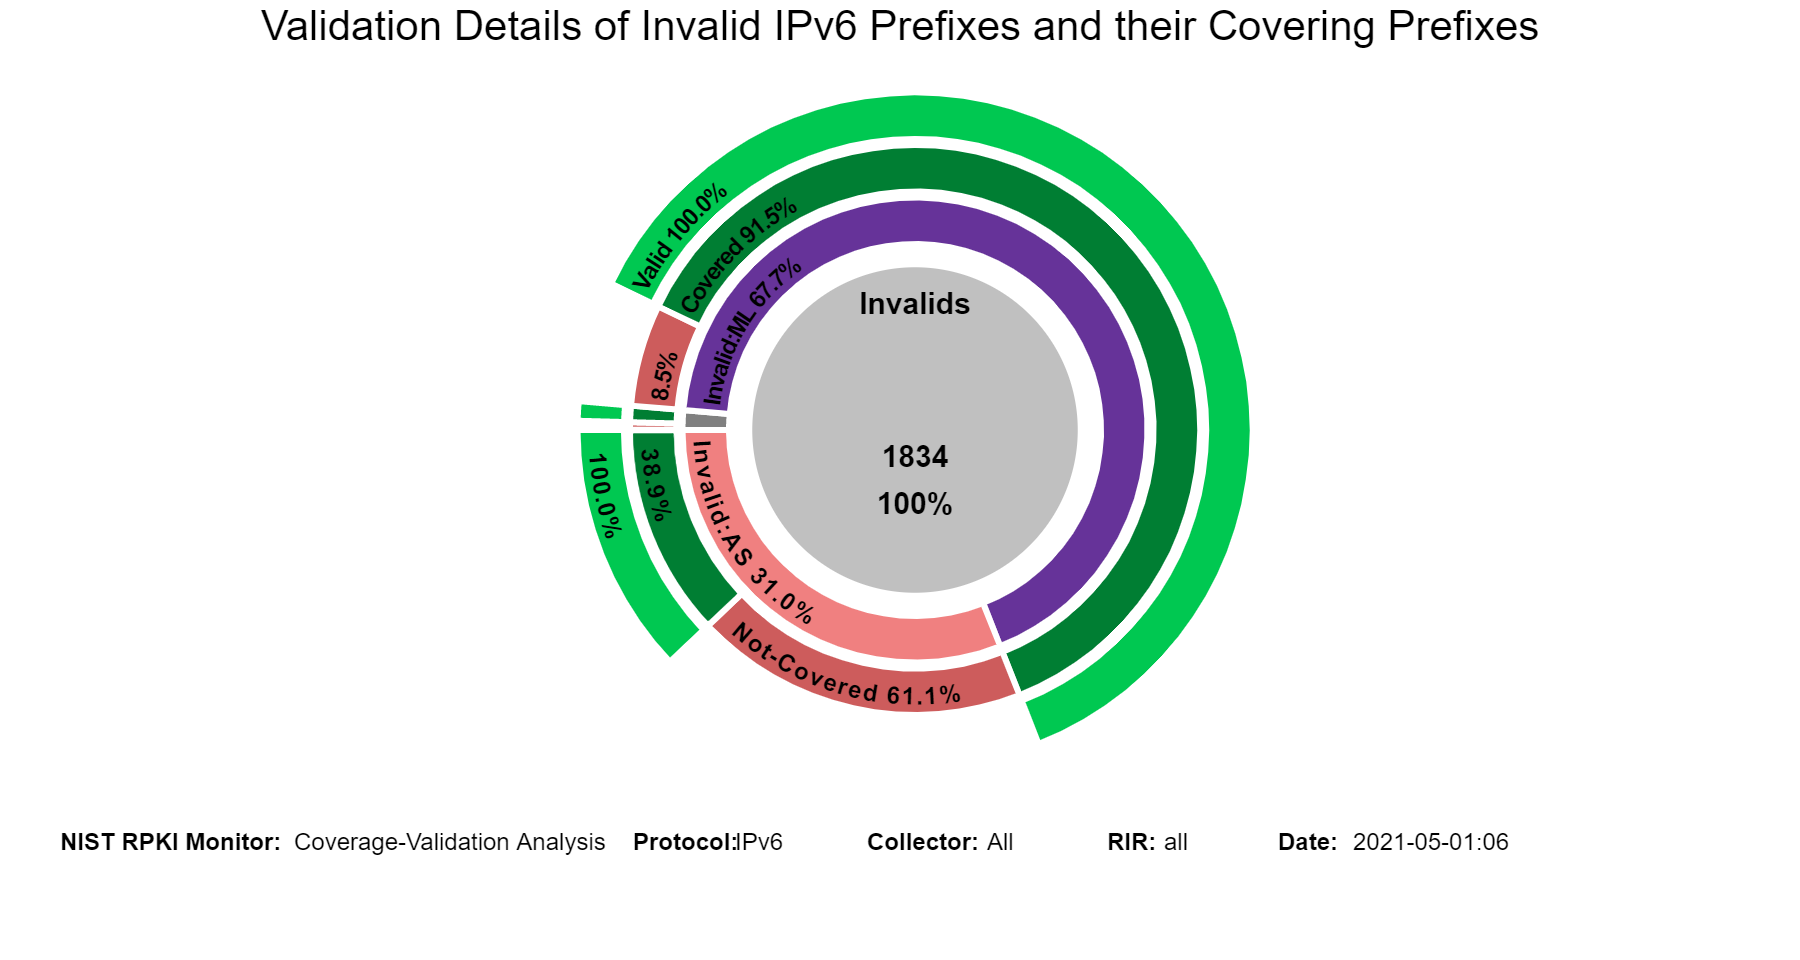
Coverage of Invalids: All Invalid Originations
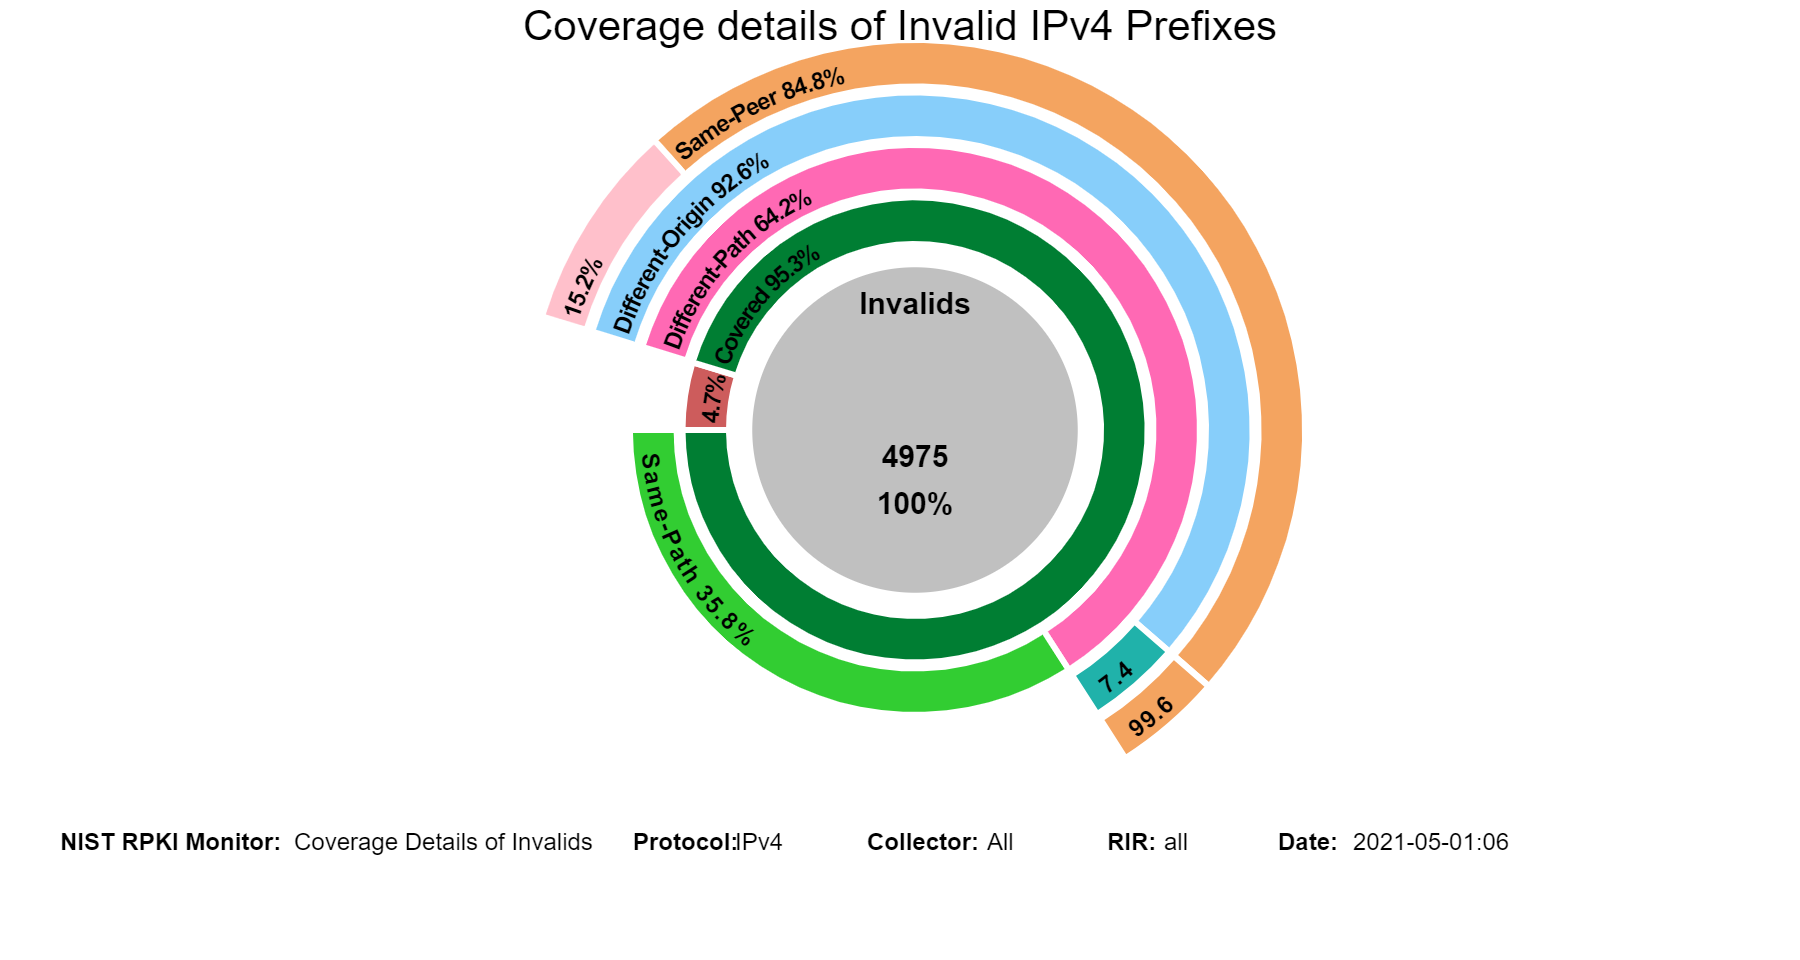
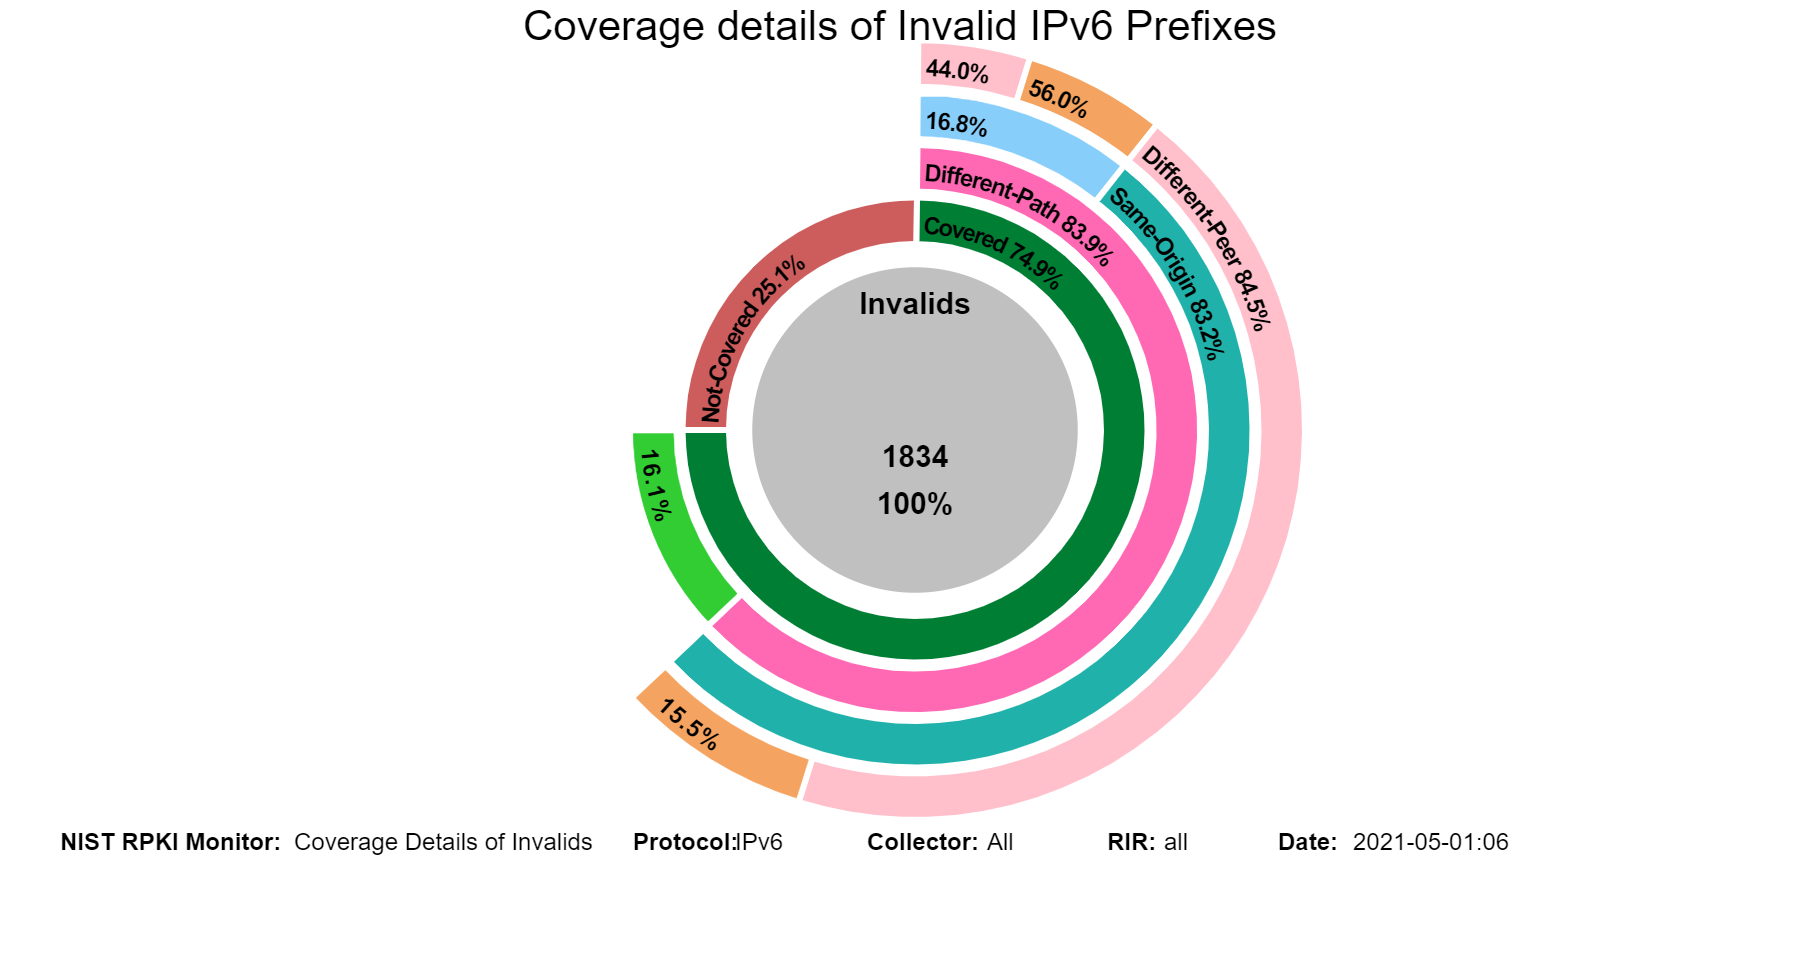
The sunburst graph below displays the coverage results for Invalid IPv4 prefixes, including the validation status of their covering prefixes. The circle in the middle lists the number of unique Invalid prefixes. The inner ring displays the coverage information, and the outer ring displays the validation status of the covering routes. While using the Monitor, hovering (using the mouse) over the different arc segments of the rings (away from the text) displays the corresponding data in the middle circle. If an arc segment is clicked on, then the sunburst is refreshed showing the measurement in that arc segment at the center and its breakout. To go back to the complete sunburst image, click in the center circle (or refresh the page). Versions of this graph for IPv6 and various RIRs can also be seen in the Monitor (jump to this analysis).
Coverage of Invalids: Coverage Details
These sunburst graphs show statistics related to path details in the coverage of unique Invalid prefixes. While the first ring displays the coverage information, the remaining rings provide a comparison between the different properties associated with the Invalid routes and their covering routes as follows: The second ring shows path comparisons in terms of the same or different AS path. The third ring displays AS origin comparison between the two routes when the AS paths are different. The fourth ring provides a peer comparison (i.e., same/different peer) of the third ring results. Hovering over the different arc segments of the rings (away from the text) displays the corresponding statistics in the middle circle. If an arc segment is clicked on, then the sunburst is refreshed showing the measurement in that arc segment at the center and its breakout. To go back to the complete sunburst image, click in the center circle (or refresh the page) (jump to this analysis).
 The graph below depicts the history results for path comparison between Invalid routes and their covering routes specifically focusing on the same vs. different path. By hovering over the graph, the details in terms of numbers and dates can be seen (jump to this analysis).
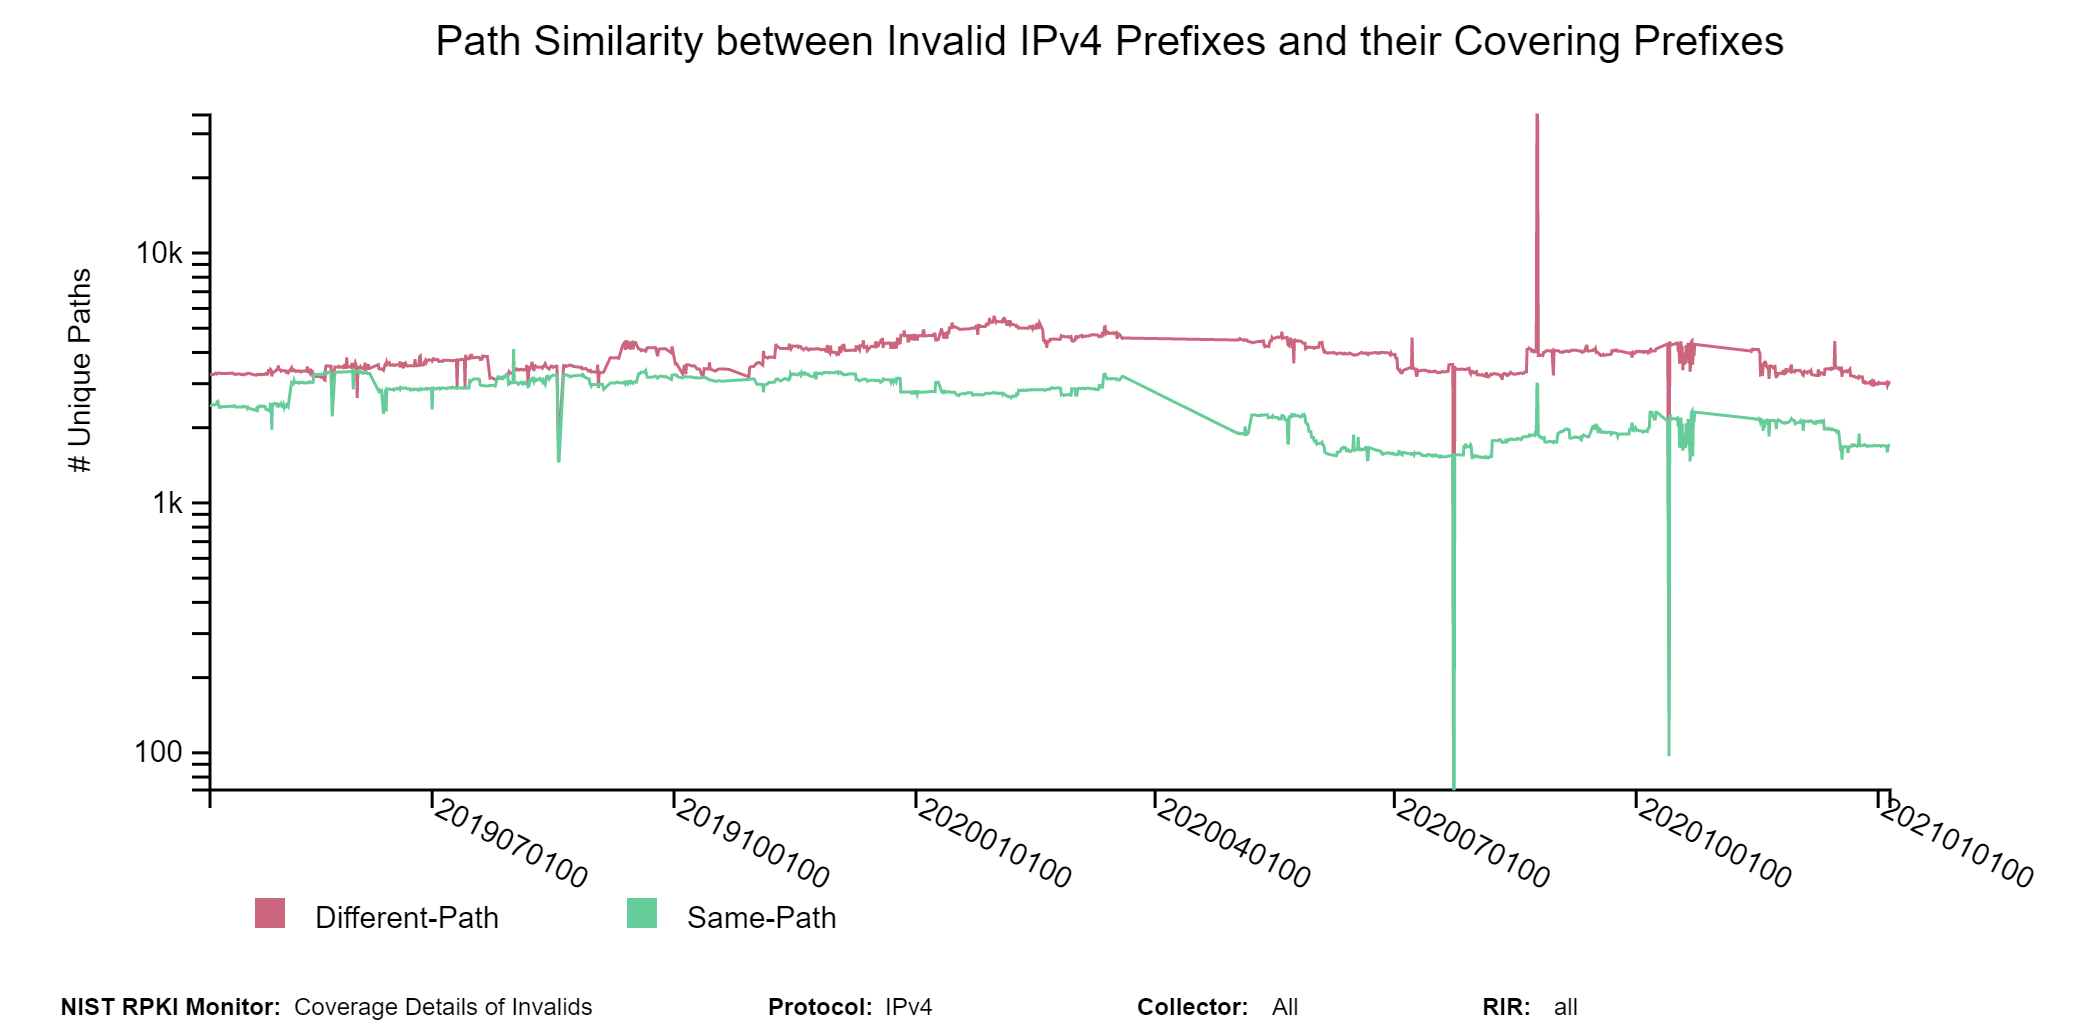
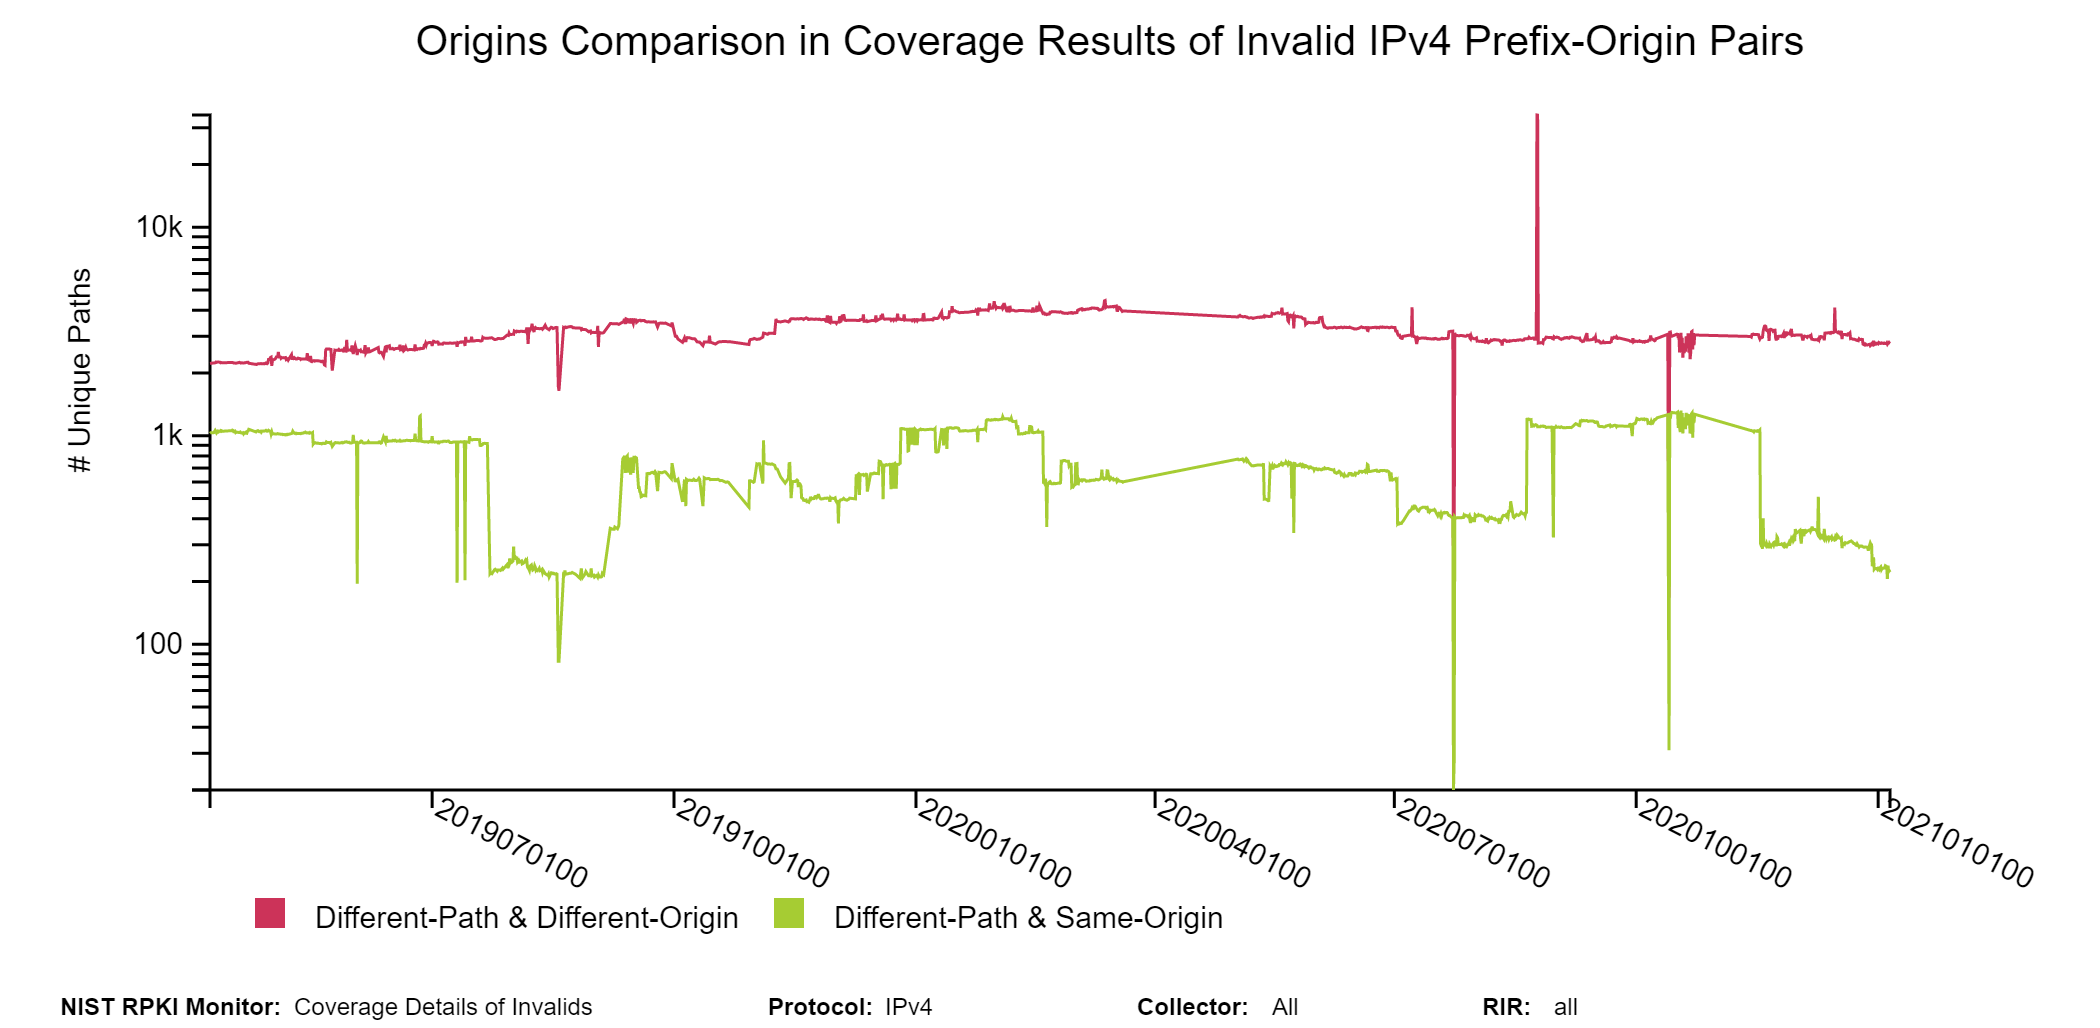
In the case when the two paths (Invalid vs. covering route) are different, then the origin ASes in them may be the same or different. The following graph depicts the history for different paths in terms of their breakdown into having the same vs. different origin AS (jump to this analysis).
Coverage of Invalids: Coverage-Validation
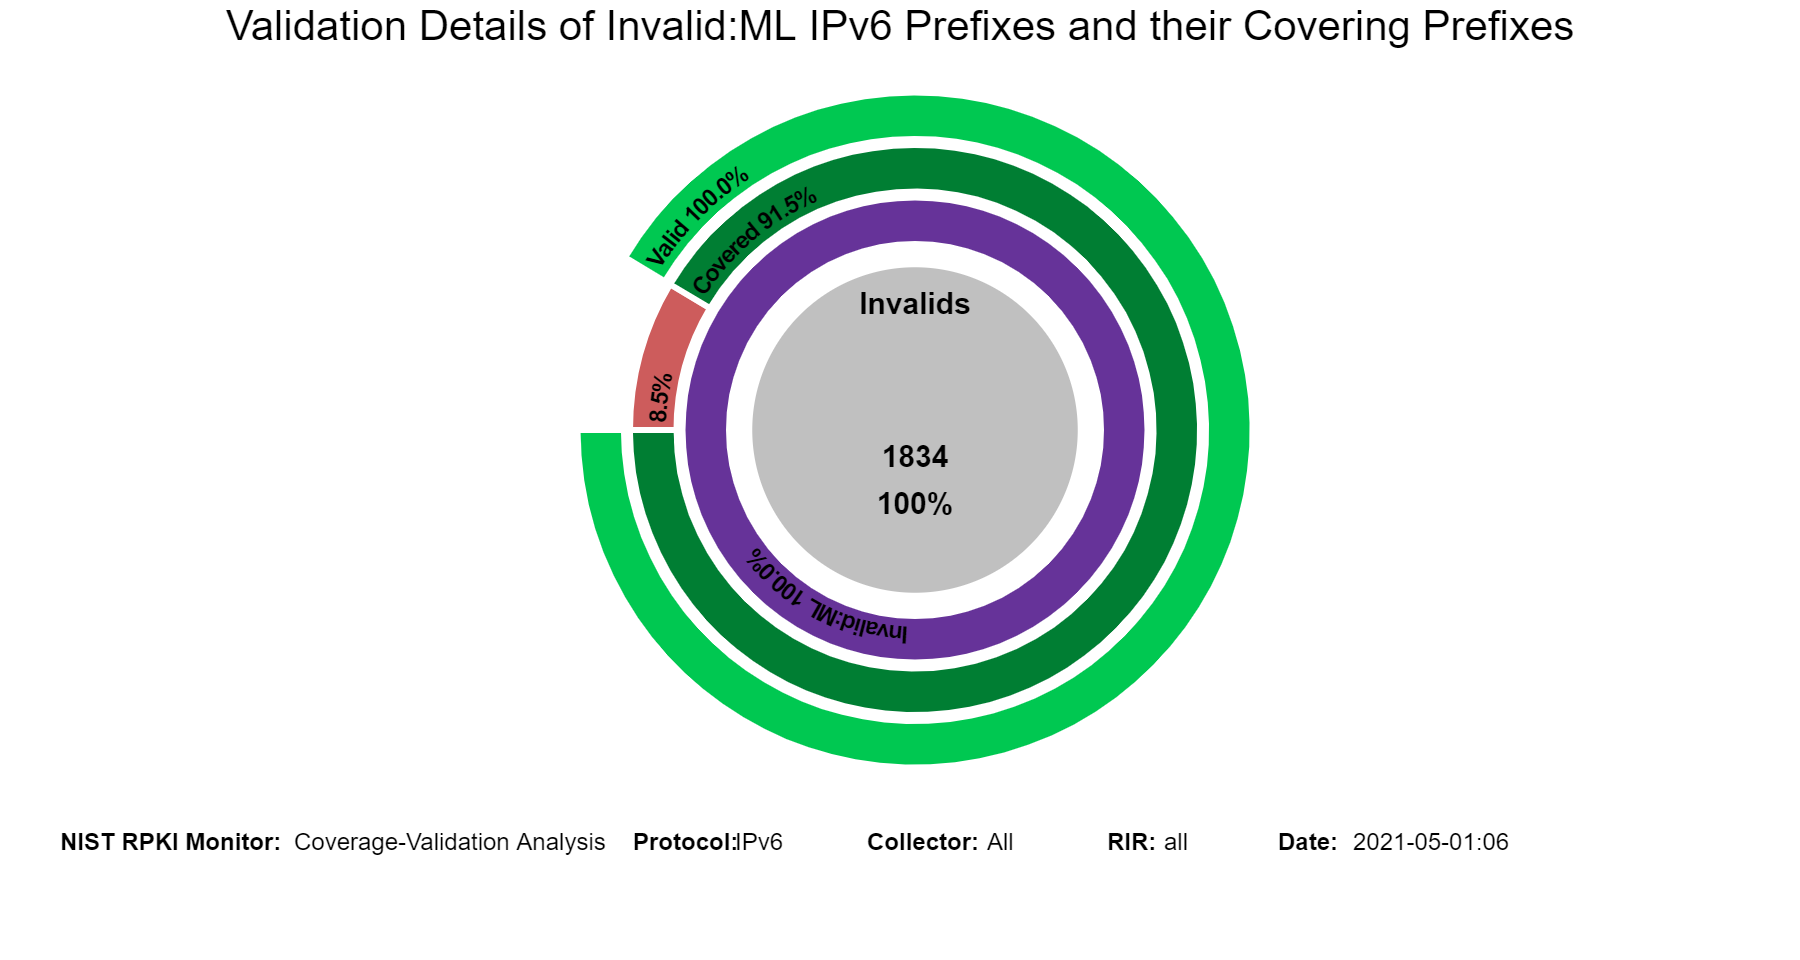
The following sunburst graphs show more details about the coverage of Invalid prefixes. The first ring provides the breakdown of Invalids according to Invalid:AS, Invalid:ML, and Invalid:AS&ML. The second ring provides coverage status of each of the Invalid types of the first ring. The outermost ring provides the validation status of the covering routes. Hovering over the different segments of the rings displays the corresponding statistics in the middle circle (jump to this analysis).
 When in this section, from the menu at the top it is possible to select the type of Invalid (Invalid:AS, Invalid:ML, Invalid:AS&ML) and then the details for the selected Invalid type are displayed. The examples below are for the case of Invalid:ML.
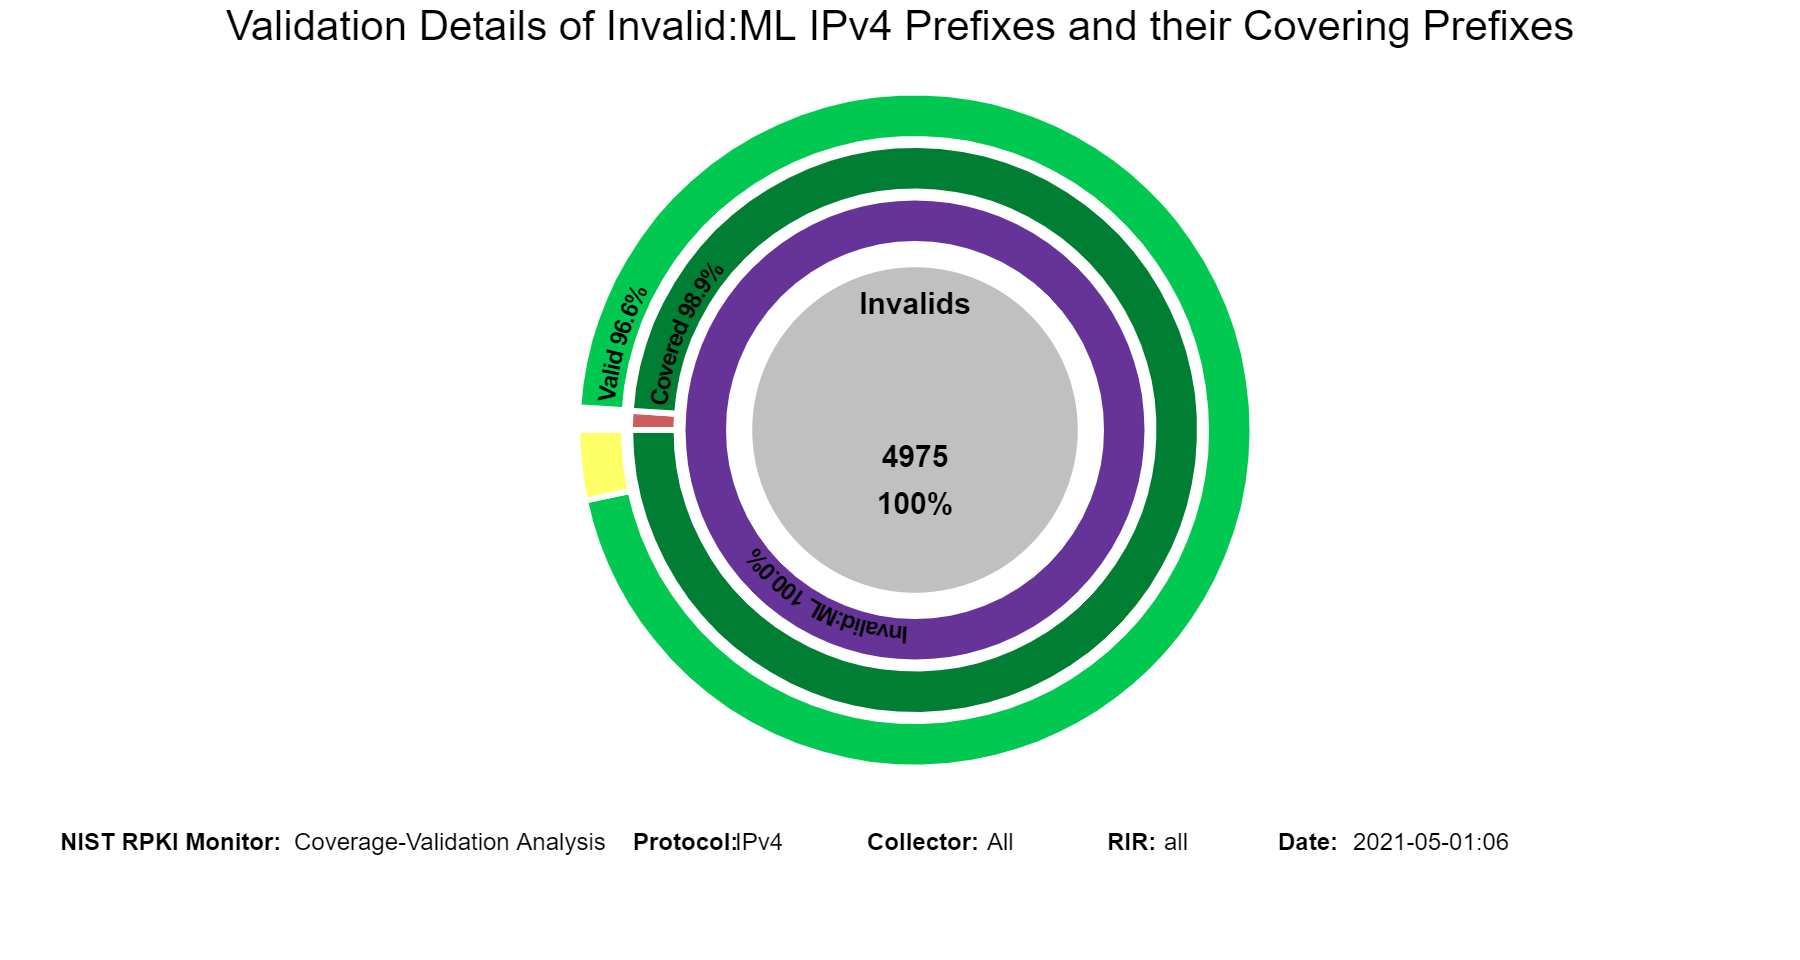
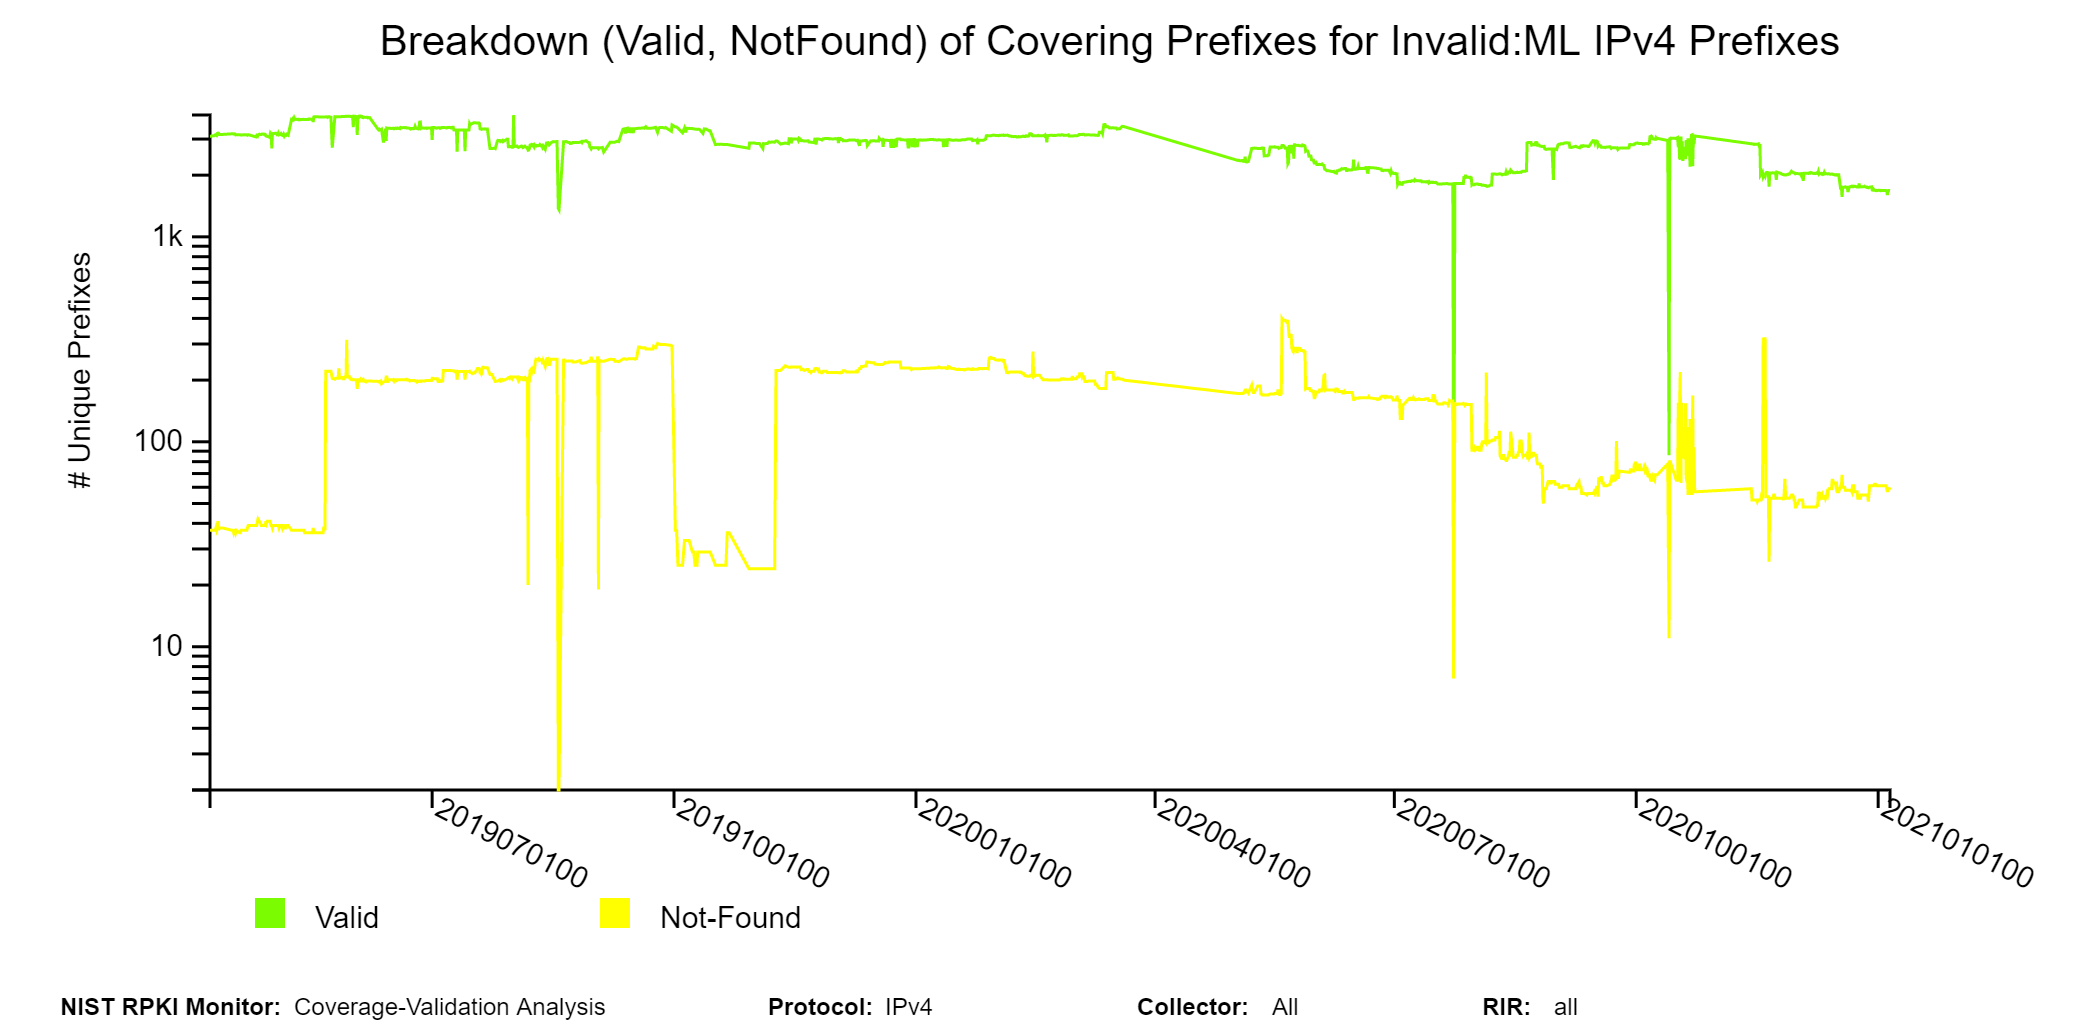
 The graphs below are similar to the history graphs for Invalid prefixes shown above but specific to the selected Invalid type (Invalid:ML in this instance, jump to this analysis).
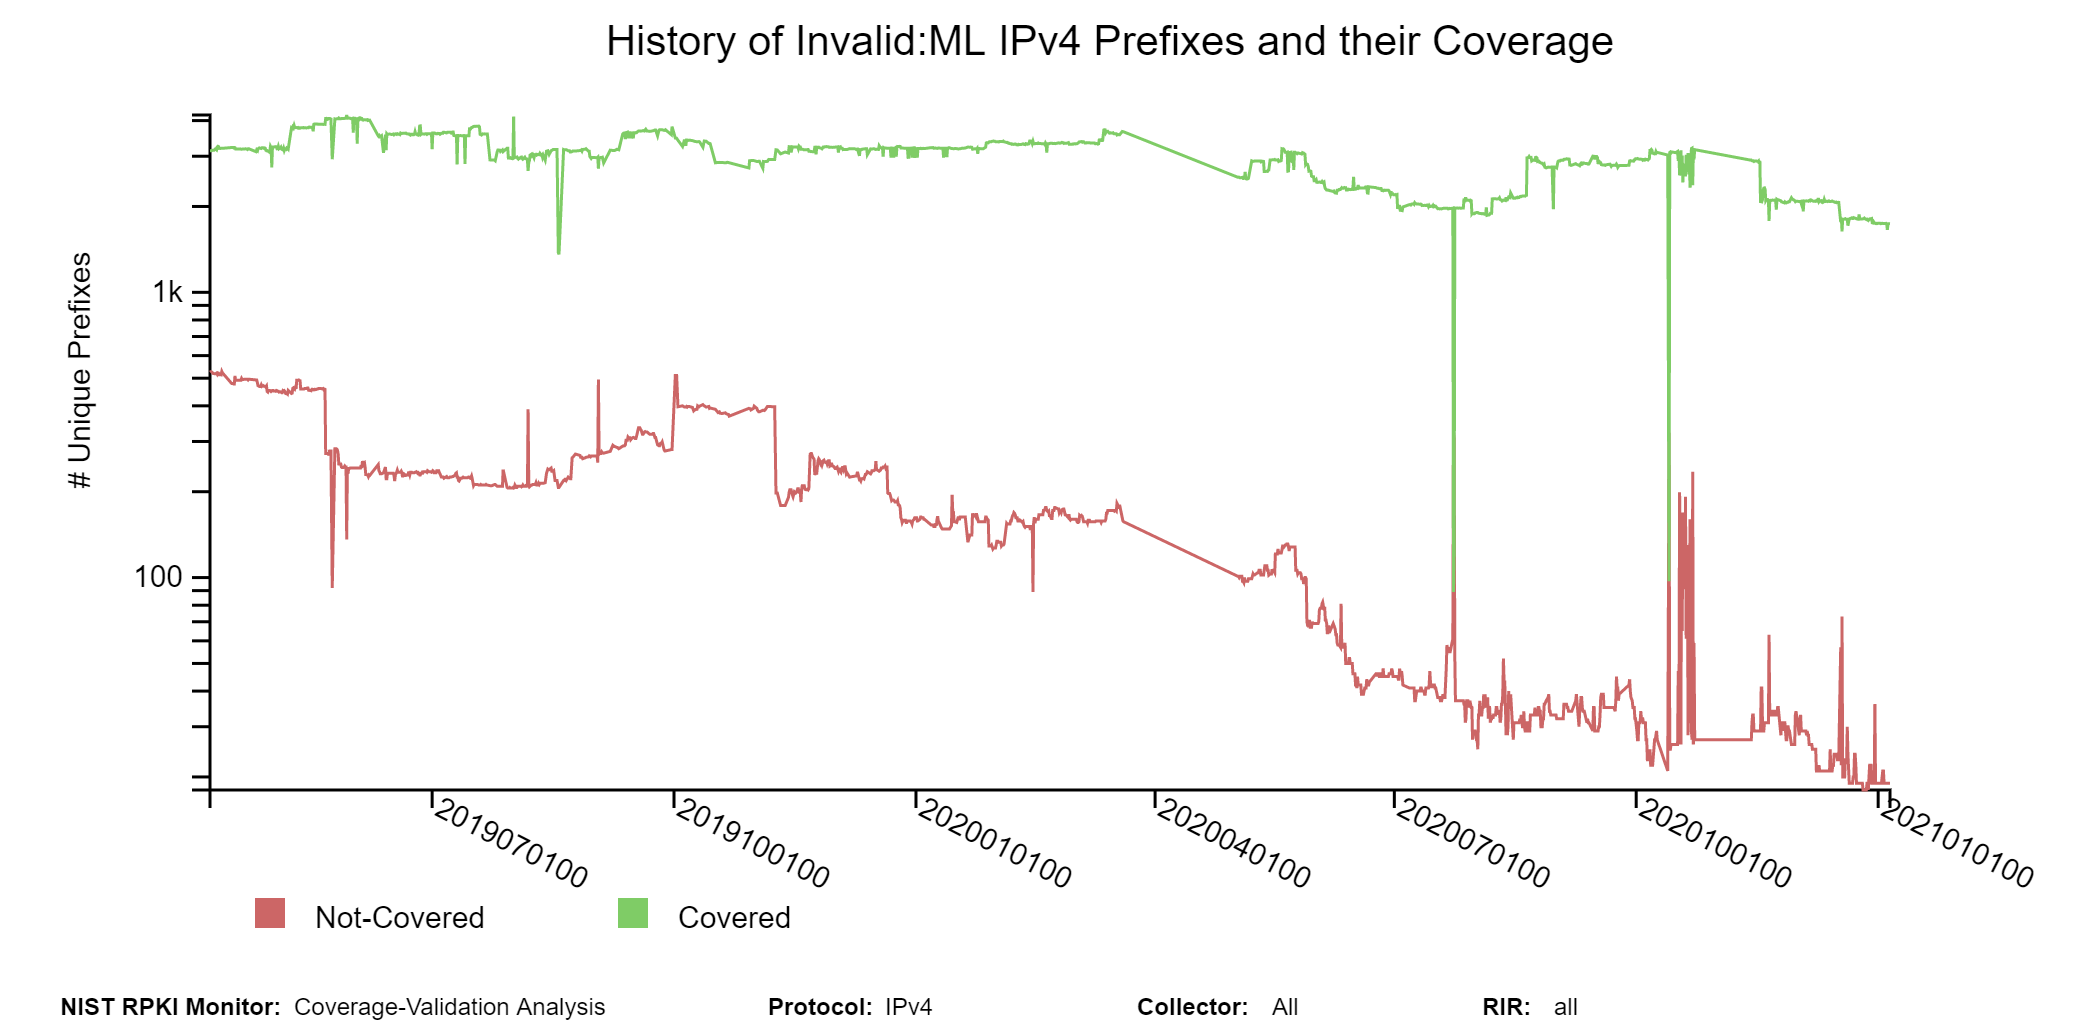
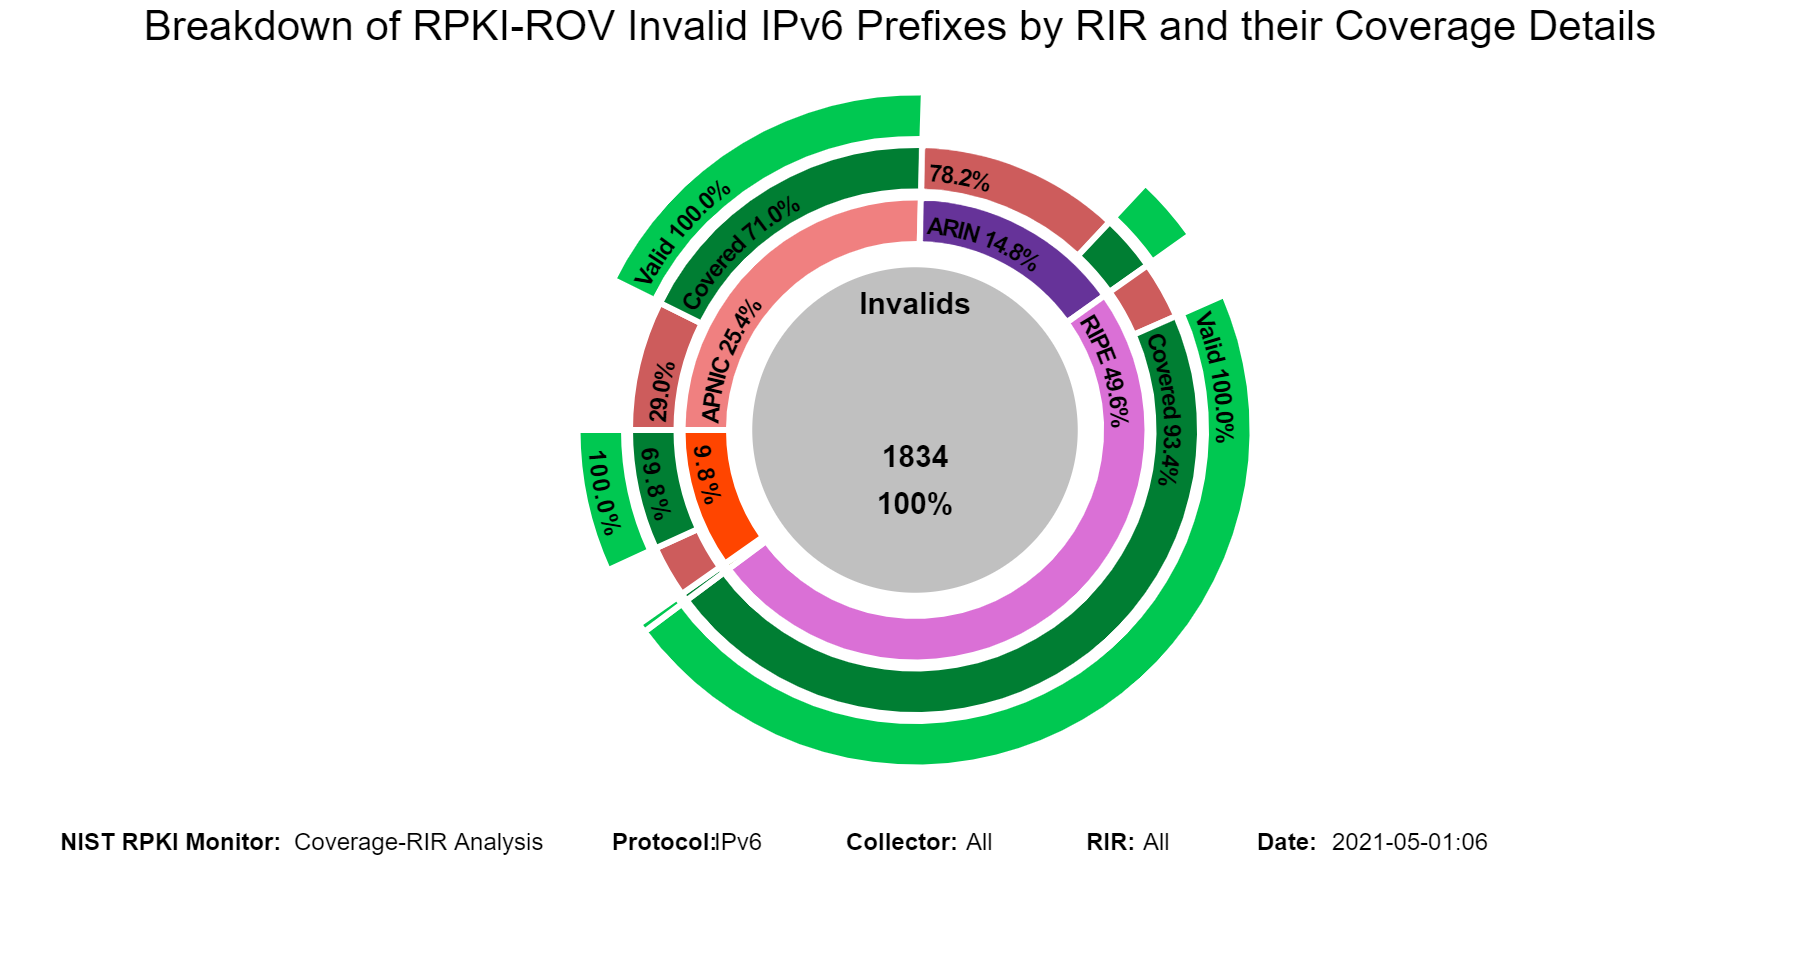
Coverage of Invalids: Coverage-Region
The sunburst graphs below show more details about the coverage of Invalid prefixes. The first ring provides the breakdown of Invalid prefixes according to RIR registries (ARIN, APNIC, LACNIC, RIPE, and AFRINIC). The second ring provides statistics on the coverage status of Invalid prefixes for each of the regions of the first ring. The outermost ring provides statistics on the validation status of the covering routes. Hovering over the different segments of the rings displays the corresponding statistics in the middle circle (jump to this analysis).
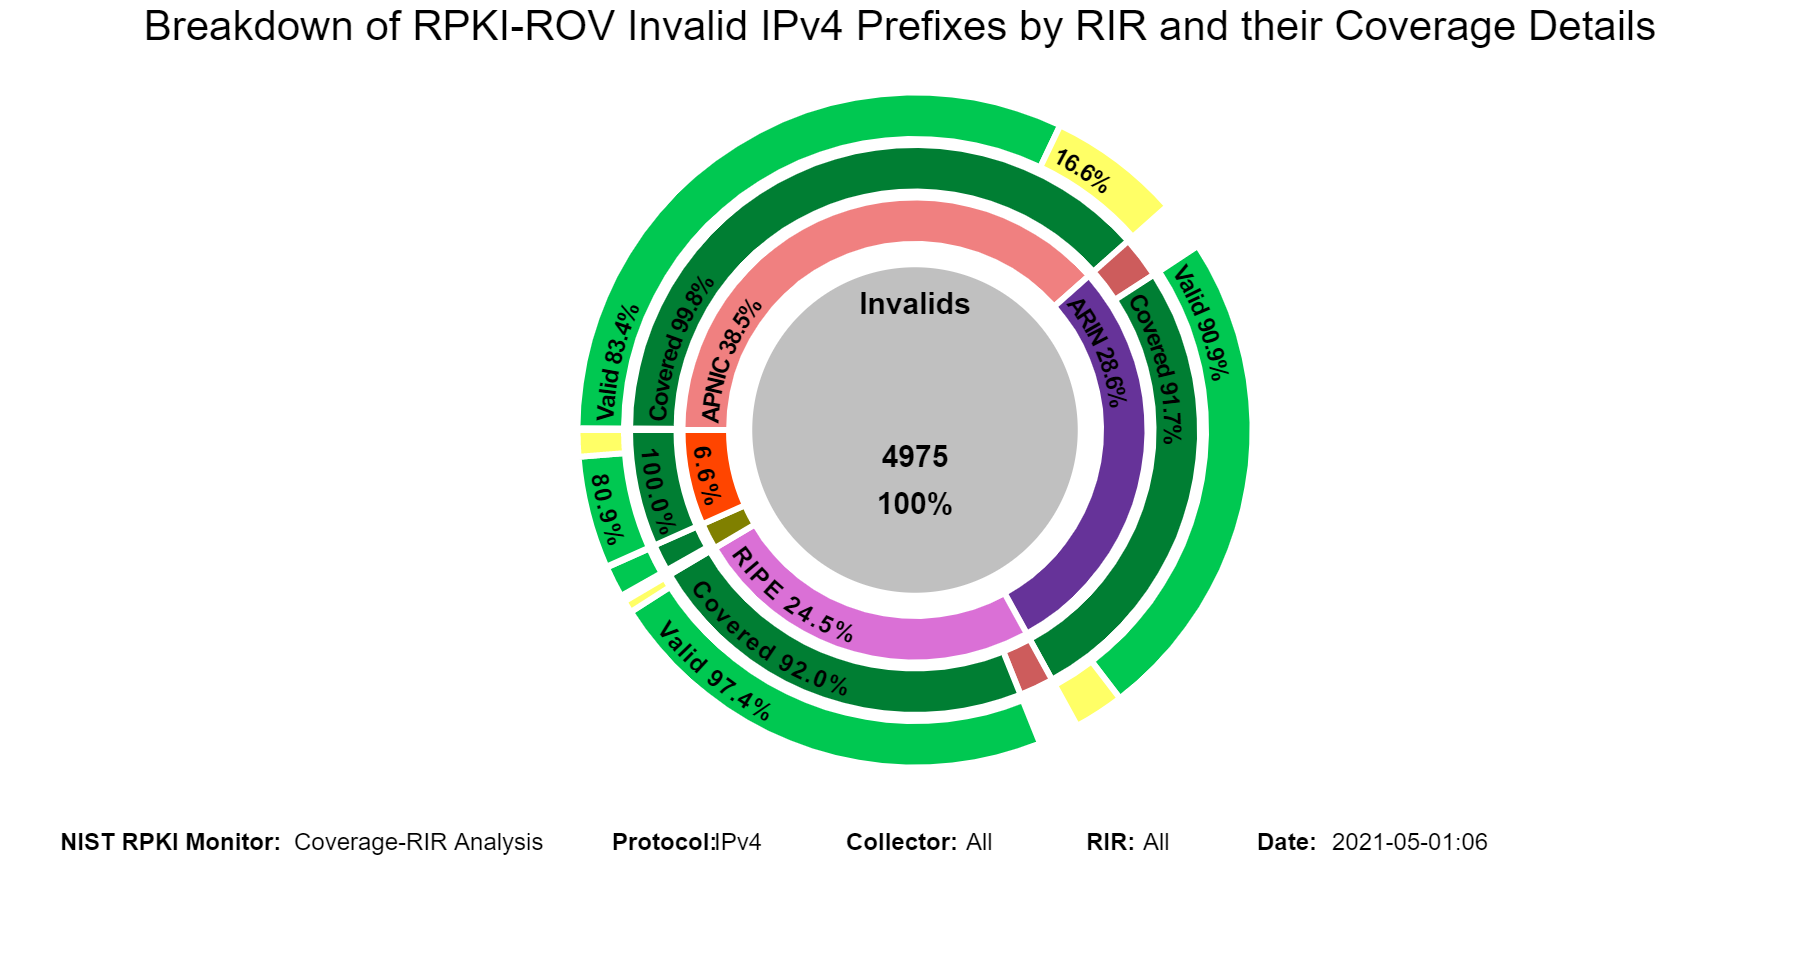
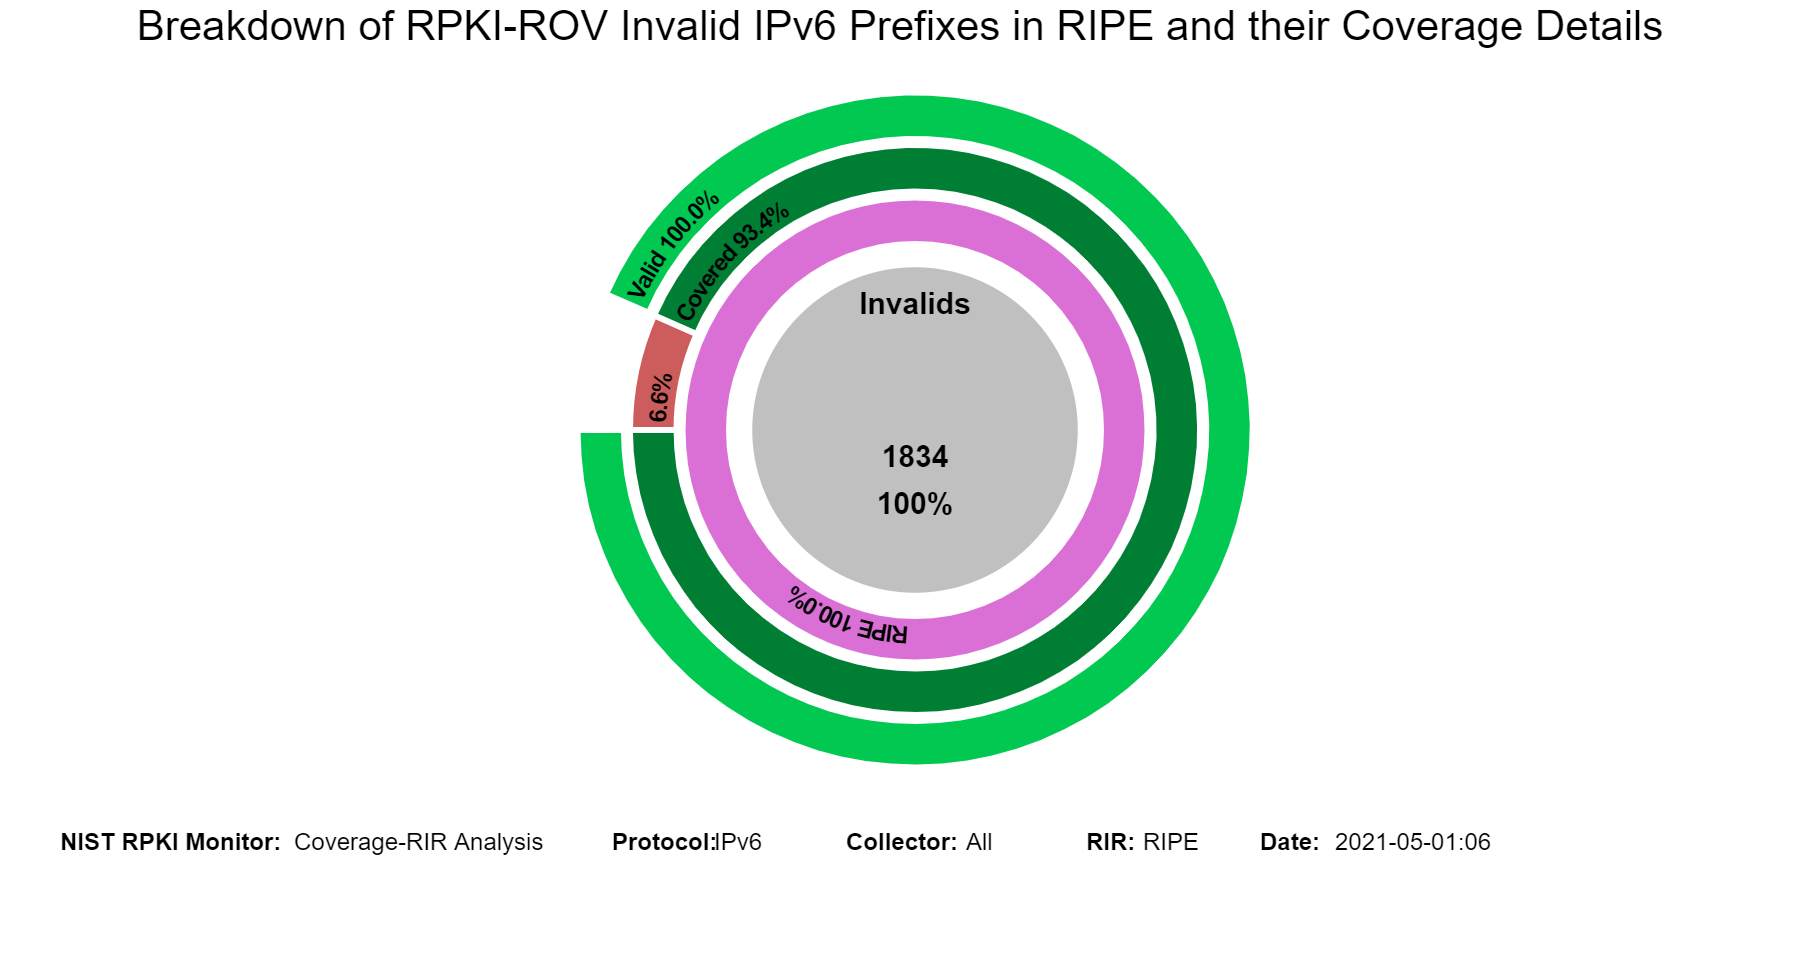
 When in this section, from the menu at the top it is possible to select the RIR region, and then the statistics related to the coverage of Invalids for the selected region are displayed. The examples below are for the case of Invalids in RIPE.
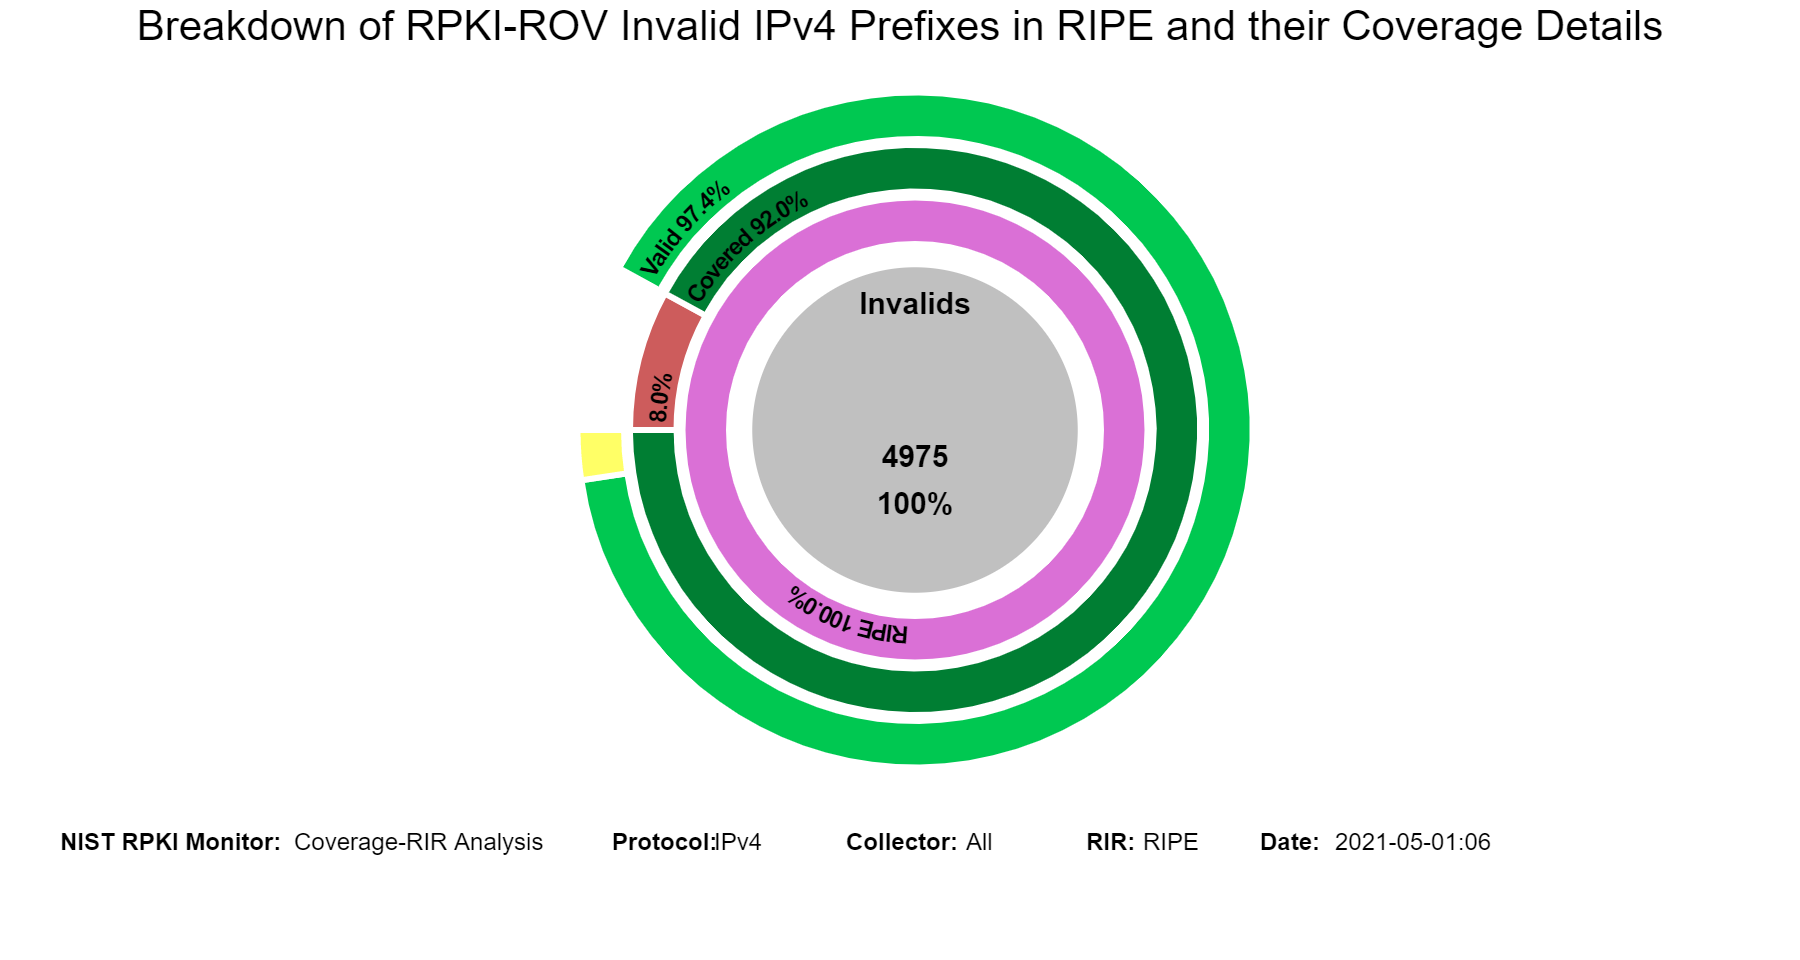
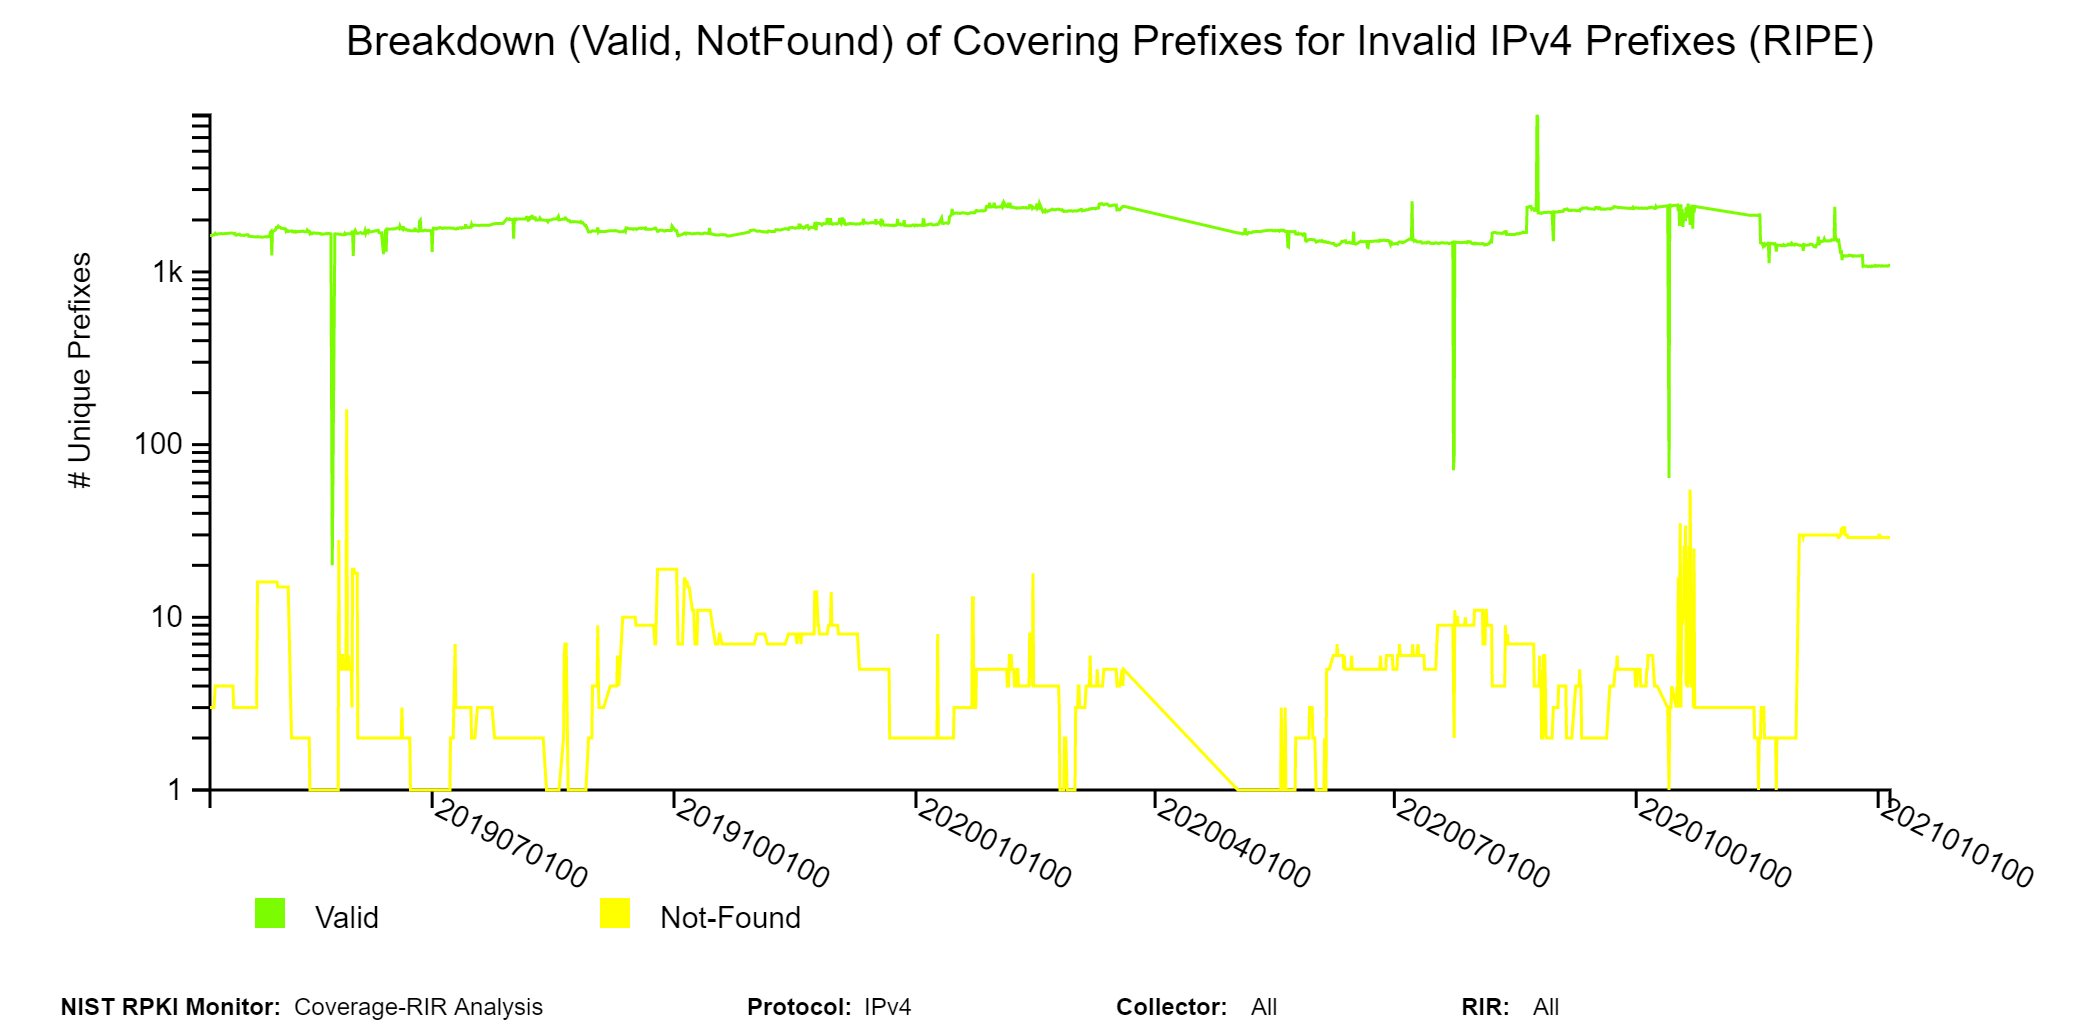
 The graphs below are similar to the history graphs of the coverage of Invalid IPv4 prefixes shown above but specific to the selected RIR region (RIPE in this instance, jump to this analysis).
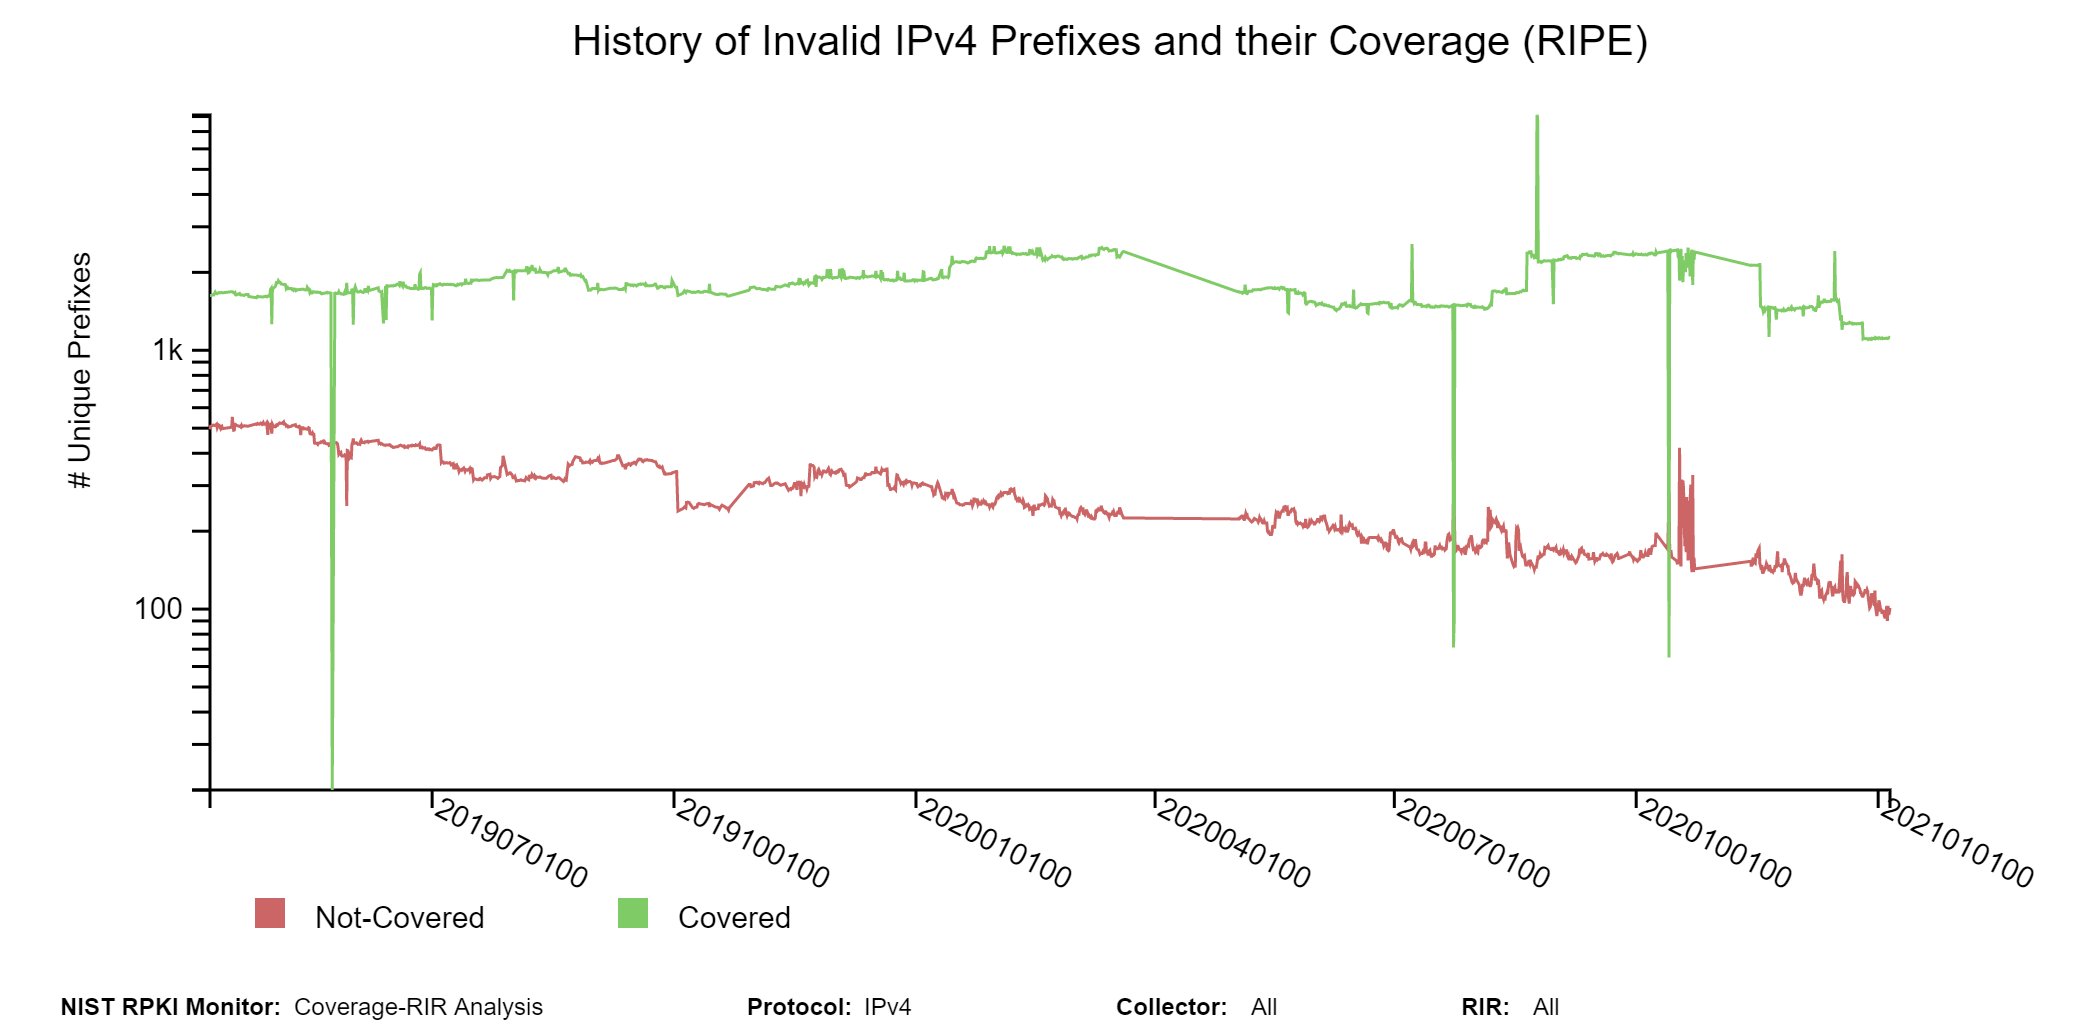
Invalid Prefix-Origin Pairs
In this part, the list of Invalid Prefix-Origin pairs together with the coverage results for the Invalid prefixes is provided. Data displayed in this section includes the Invalid prefix, Autonomous System that observed it, the prefix’s Regional Internet Registry, its RPKI-ROV Invalid type (Invalid:AS, Invalid:ML, etc.), number of paths associated with it, and coverage result (either covered or not covered) (jump to this analysis).
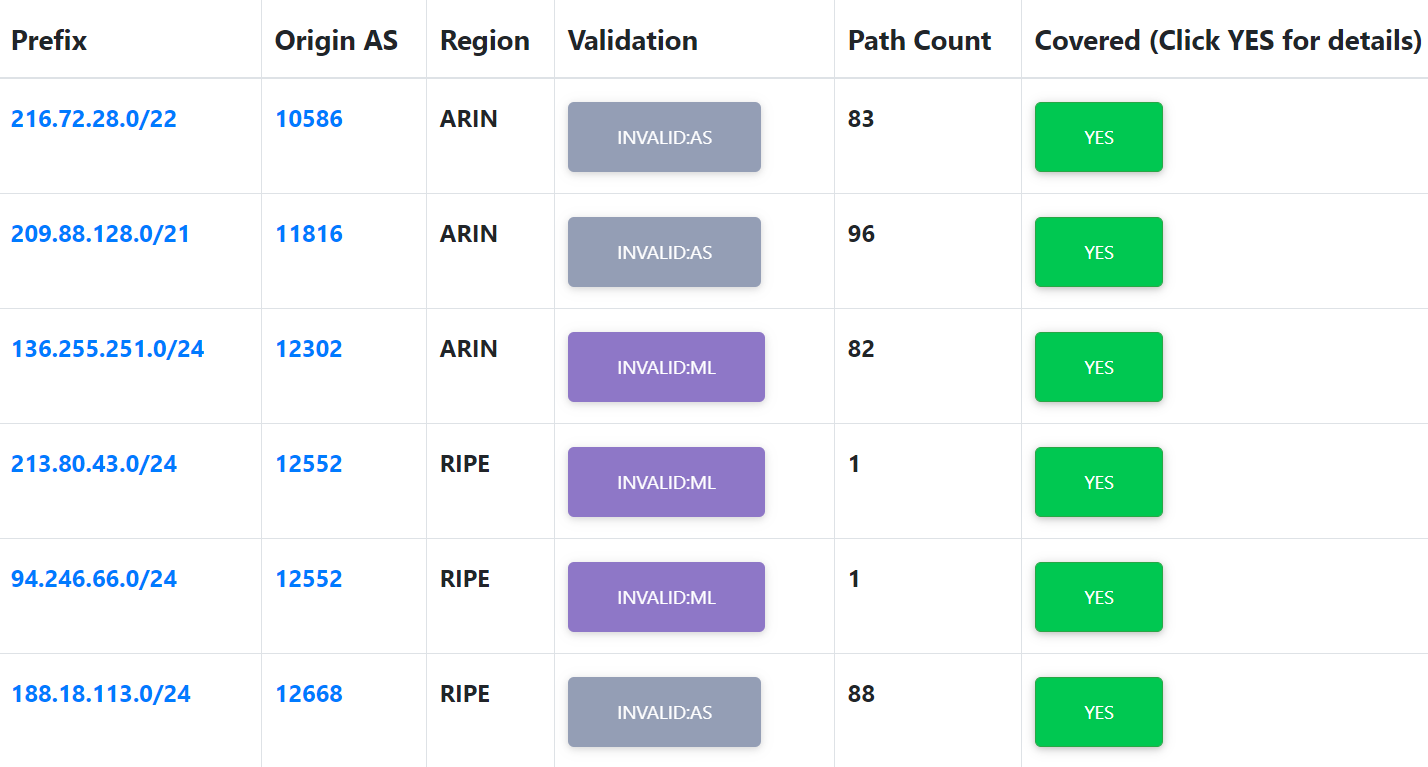
The following menu is provided at the top of the page. It allows users to filter Invalid routes according to different parameters, such as RIR, RPKI-ROV status (Invalid type), the originating AS, etc.

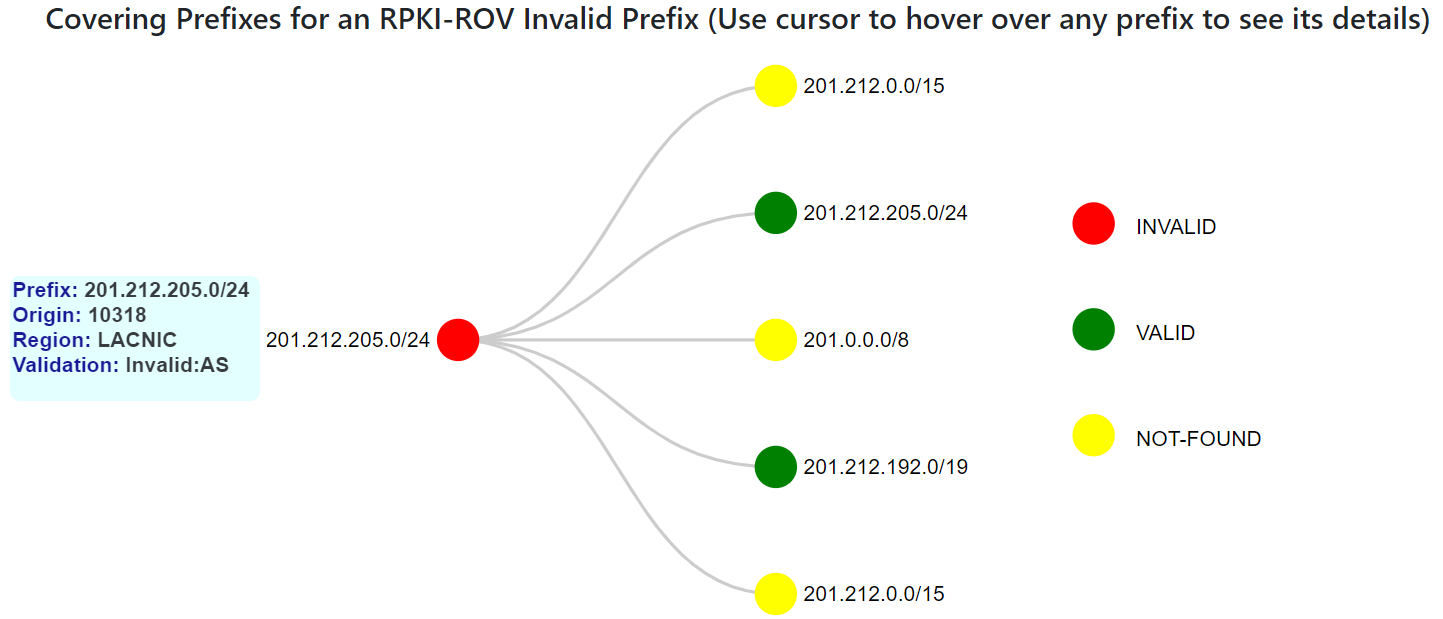
When in this section in the Monitor, click the green YES box in the “Covered (Click YES for details)” column corresponding to an Invalid prefix to get the details of covering routes for that prefix. The Invalid prefix and the covering routes are represented as a tree. Nodes in this tree illustrate prefixes and the links depict the coverage relationship. Node color is used to clarify the RPKI-ROV status of each prefix – red node for the selected Invalid prefix, yellow nodes for the covering Not-Found prefixes, and green nodes for the covering valid prefixes. The example below is for the Invalid prefix "201.212.205.0/24".
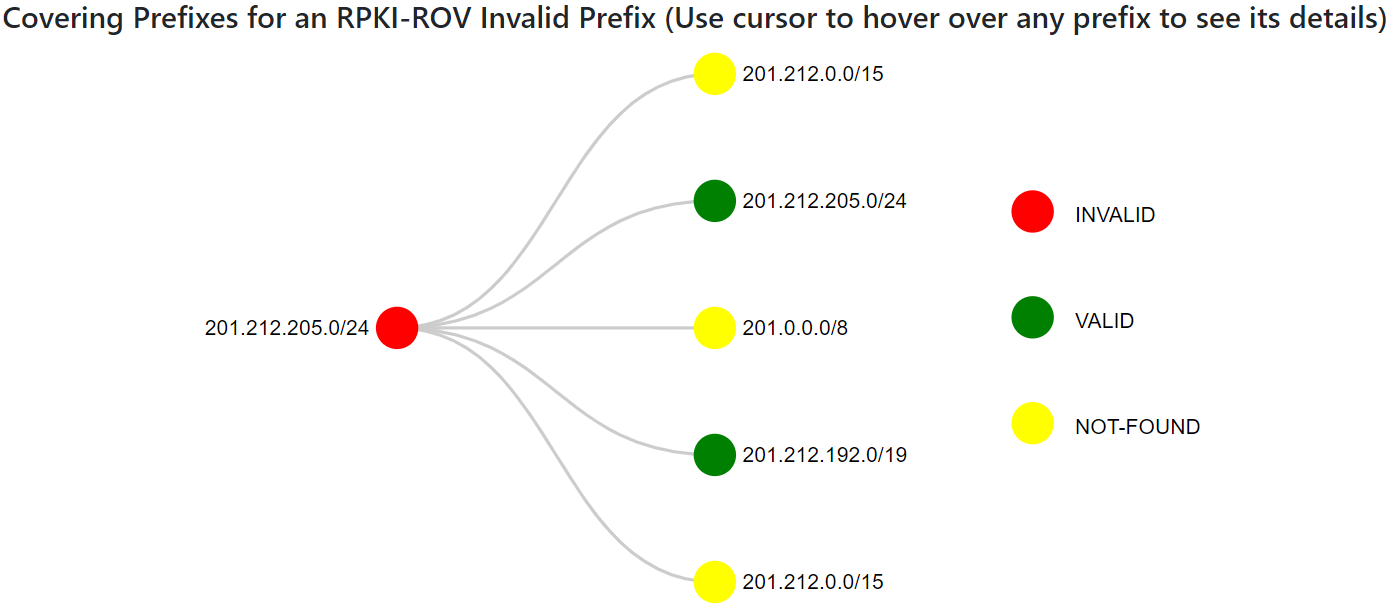
Hovering over the different nodes of the tree displays the corresponding prefix properties. It includes the origin AS, the RIR, and the RPKI-ROV status as illustrated in the figure below.
ROV Changes
In this section, we depict the set of changes (over a chosen time interval) in the RPKI-ROV status of unique Prefix-Origin pairs (for both IPv4 and IPv6). These changes are due to some modifications in the list of data objects (especially ROAs) included in the RPKI repository.
| All Changes | Displays all the RPKI-ROV changes that appeared from time1 to time2. This period is chosen by the end-user. Changes in the ROA coverage for each listed Prefix-Origin pair are identified. |
|---|---|
| Specific Prefix | Displays all the RPKI-ROV changes over a selected time interval for a selected specific prefix with temporal zoom in/out capability. |
| Specific Autonomous System | Displays all the prefixes observed in BGP by a specified Autonomous System Number. Then each prefix listed can be clicked to see the changes associated with that prefix. |
All Changes
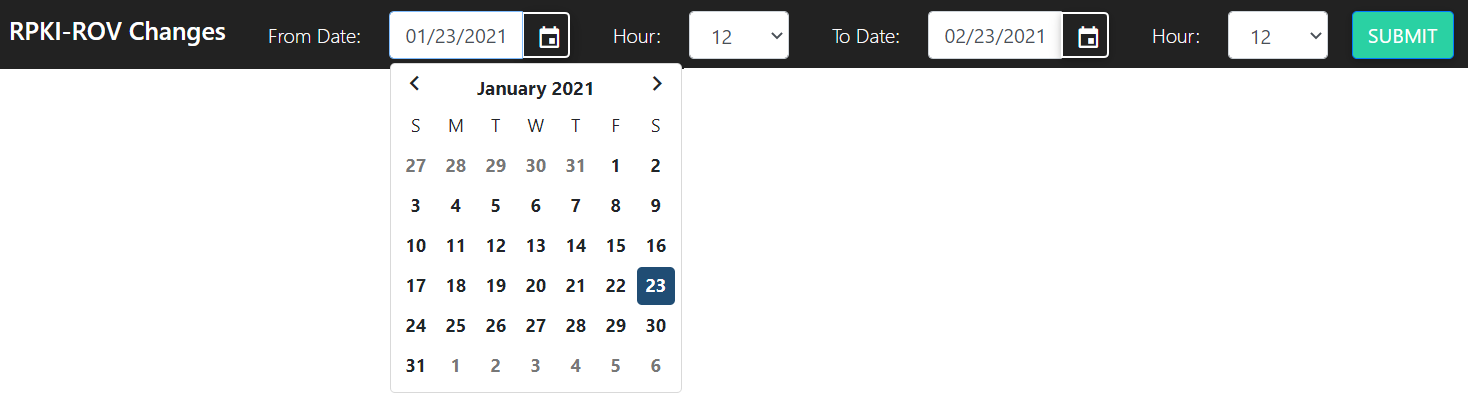
The following menu allows users to get an overview of the RPKI-ROV changes during a selected time interval. In this menu, a user can select a starting time and an ending time. Then, summaries and details of all changes that occurred in the RPKI-ROV status of IPv4 and IPv6 prefixes during the selected period will be displayed (jump to this analysis).
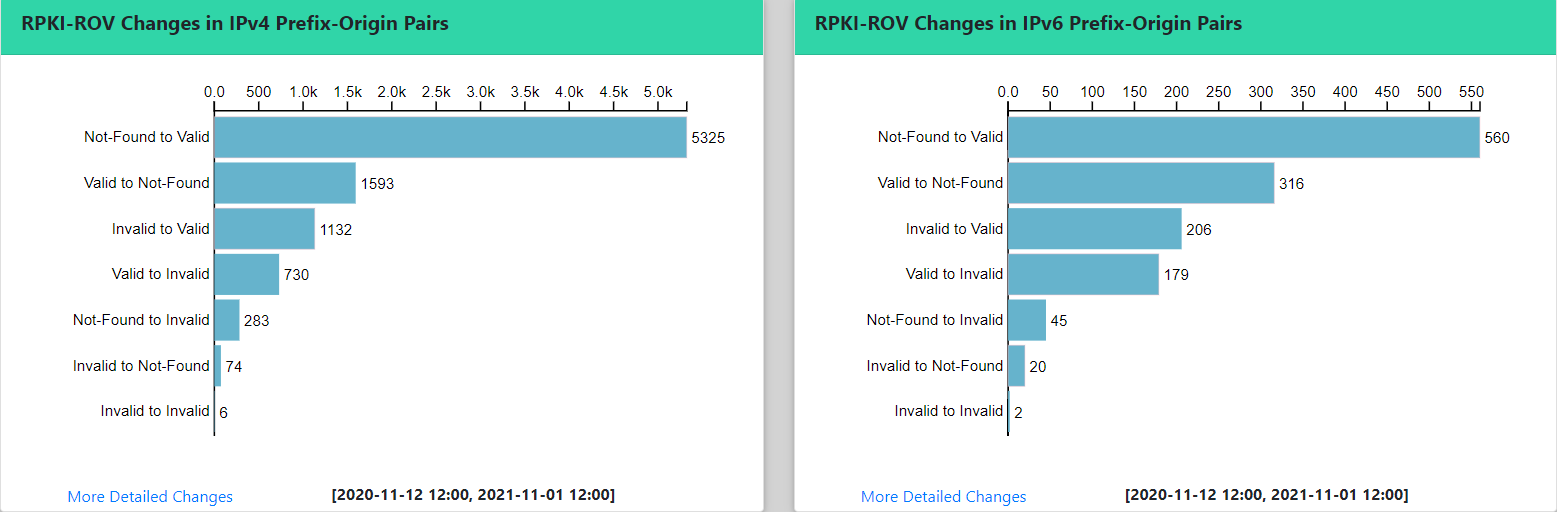
The following graphs display examples of the IPv4 and IPv6 RPKI-ROV changes. Data selected in this analysis is for a period as shown by the start/end times in the graphs. In these graphs, the total number of changes for each of the six types (Invalid to Valid, Not-Found to Valid, etc.) are shown.
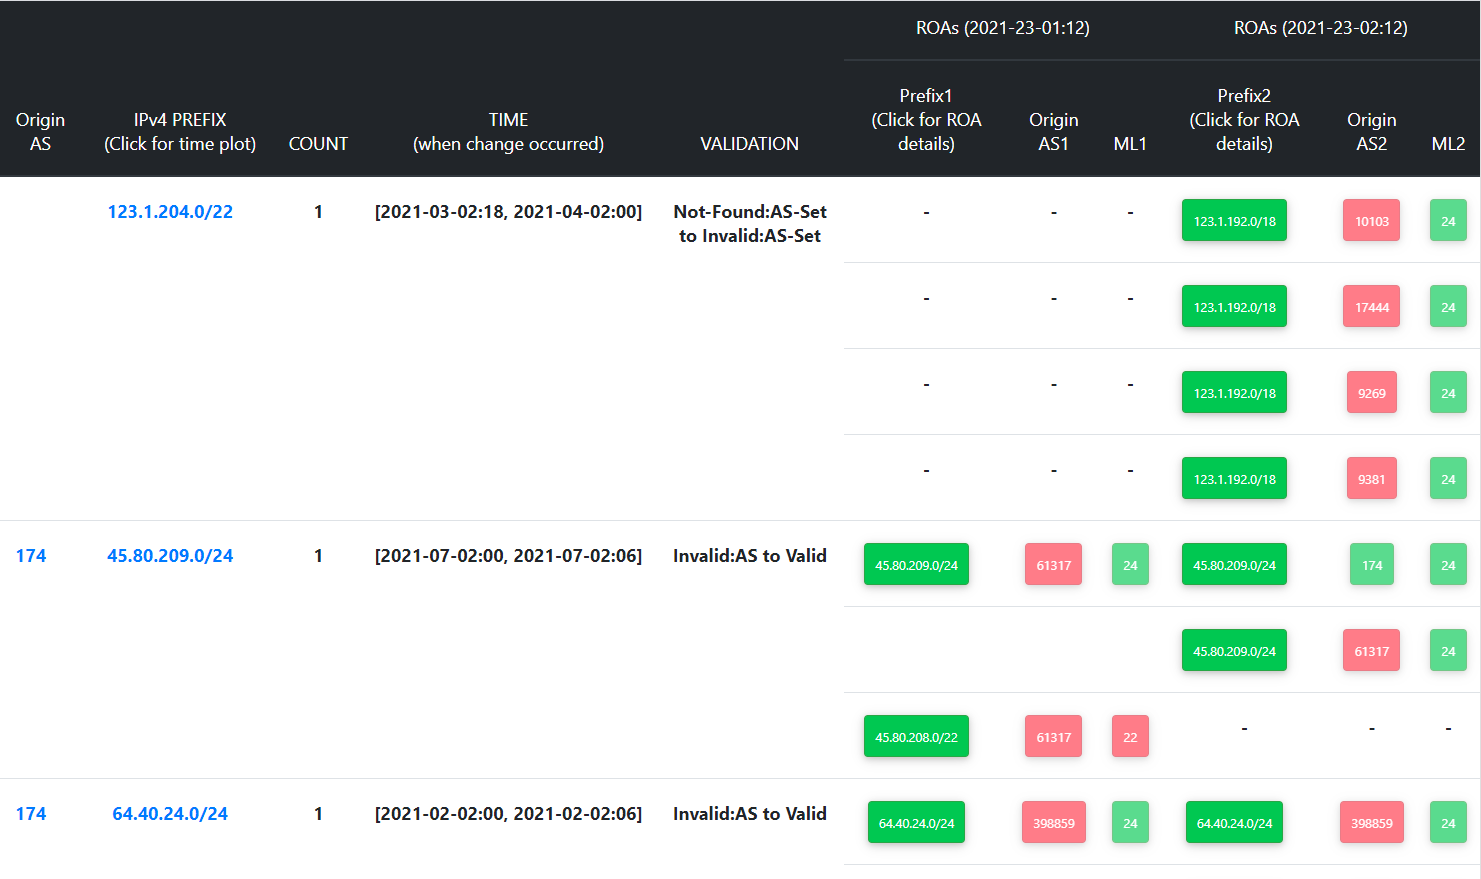
The two tables below show more details about the RPKI-ROV changes for IPv4 and IPv6, respectively. The left side of either table shows the prefix data such as the origin AS, number of changes (COUNT), etc. As stated earlier, we collect Routeviews BGP data at six-hour intervals. Accordingly, the left side of the table also shows the six-hour time interval in which the change was first noticed. The right side of the table displays the changes in the ROA object, namely, ROA at the beginning of the selected time interval (Prefix 1, Origin1, ML1) vs. ROA at the end of it (Prefix 2, Origin2, ML2). ML here denotes max-Length. When the user clicks on a specific prefix (on the extreme left), then all the RPKI-ROV changes associated with the prefix are displayed (this will be described further in the next section “Specific Prefix”). When the user clicks on the origin AS number (leftmost column), then all the prefixes observed by that AS are displayed (this will be described further in the section “Specific Autonomous System”). On the right side of the table, by clicking on the ROA prefix (Prefix 1 or Prefix 2), we get more information about that ROA as shown in the third table below.
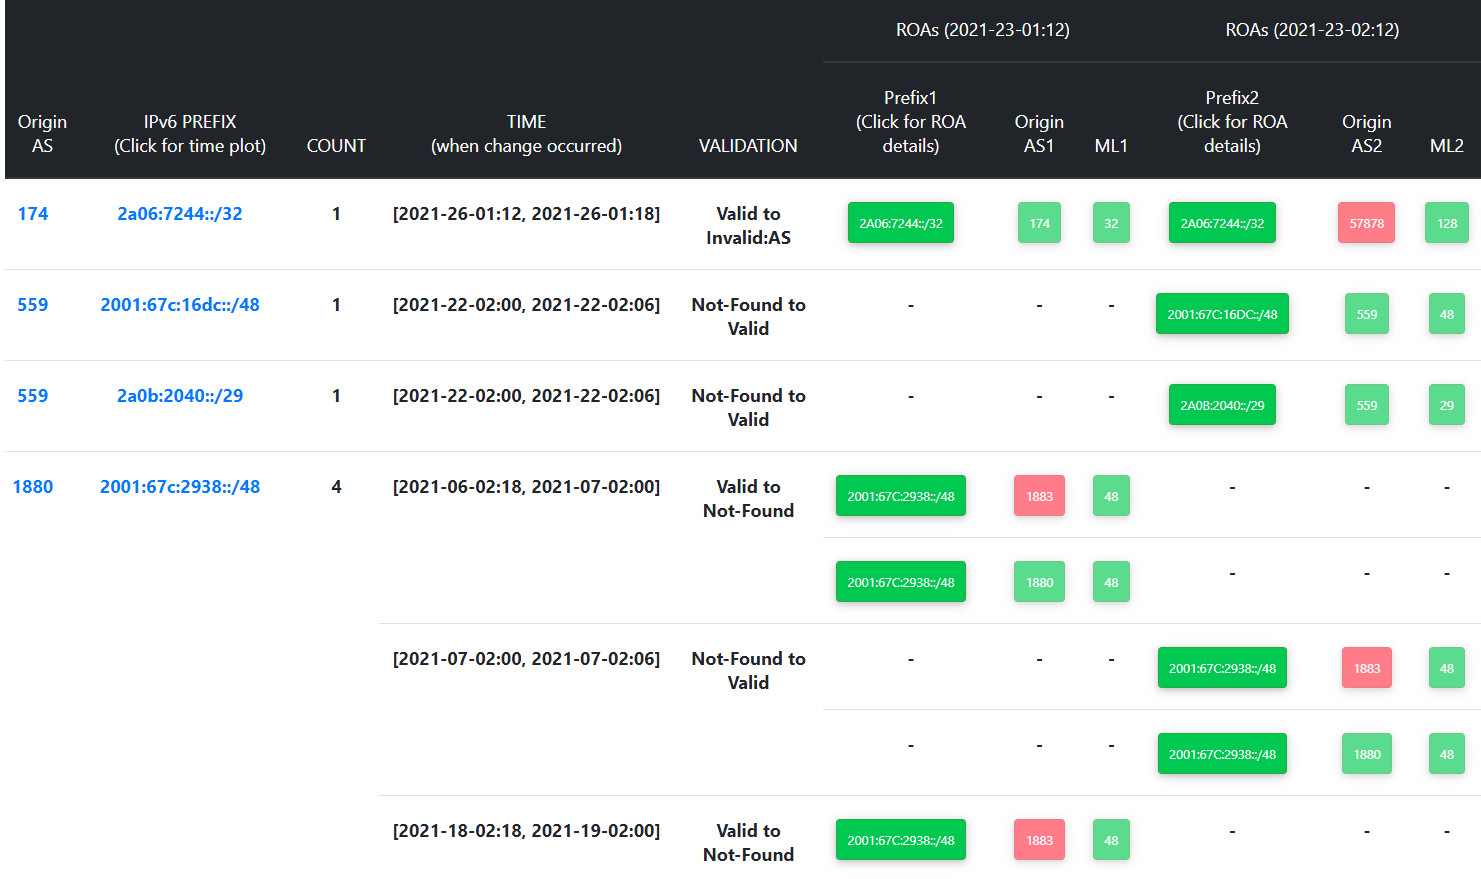
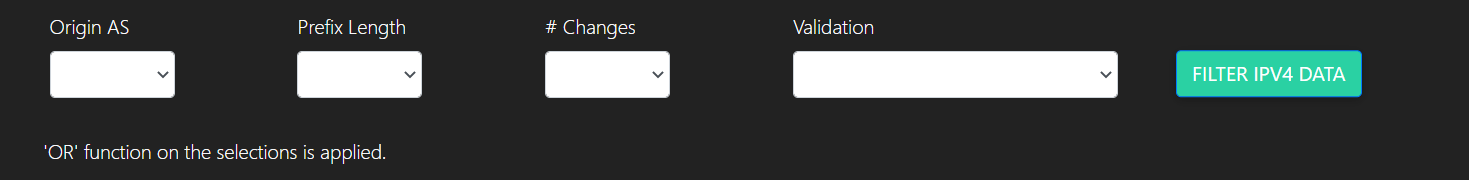
The following menu that appears on the page (i.e., the tab “All Changes”) that is being described here allows users to filter results of the RPKI-ROV changes along various dimensions. These dimensions include the Autonomous System that originates the prefix, the prefix length, number of RPKI-ROV changes, and the type of change. The filtering happens after the user makes one or more of these choices and clicks on the green-colored ‘FILTER IPV4’ button on the right. The filtering is implemented with an ‘OR’ function across these choices (not ‘AND’). This filtering is available for the corresponding IPv6 table as well.
Specific Prefix
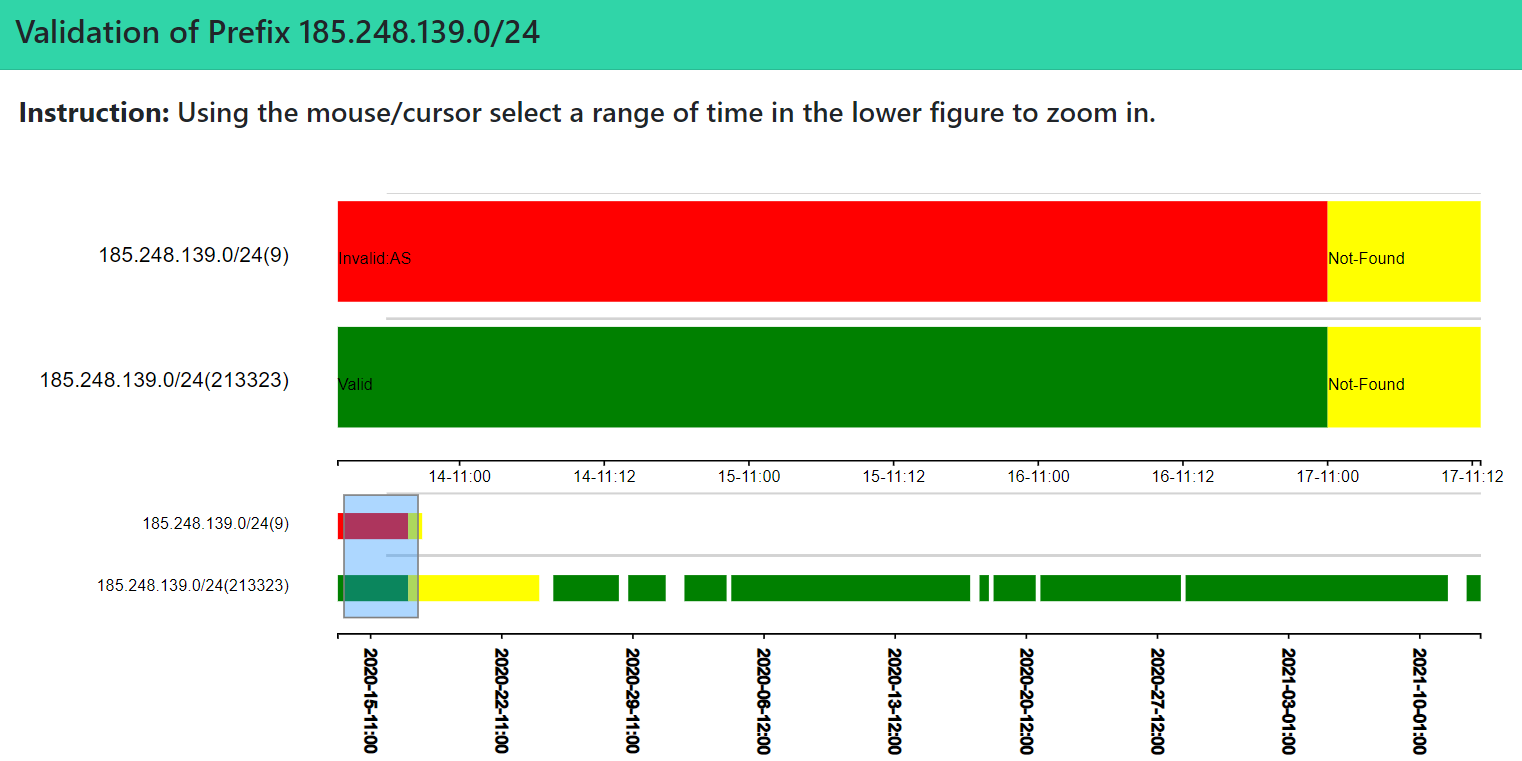
When the user is in the section “All Changes” (described above) and clicks on a specific prefix (on the extreme left) in the table, then all the RPKI-ROV changes associated with the prefix are displayed. Then the resulting window essentially puts the user in this section or tab (i.e., “Specific Prefix”). Alternatively, when in this section, a user can type in one specific prefix, and then all the details of RPKI-ROV changes (if any) for the prefix are displayed. For the case where the selected prefix is observed by different Autonomous Systems, multiple main lanes (at the lower level) and secondary lanes (at the upper level) are provided (as shown in the figure below). Each lane represents one specific Prefix-Origin pair (jump to this analysis). In the example below, the prefix is observed by four different ASes. The function of the secondary lanes (at the upper level) will be described shortly (below).
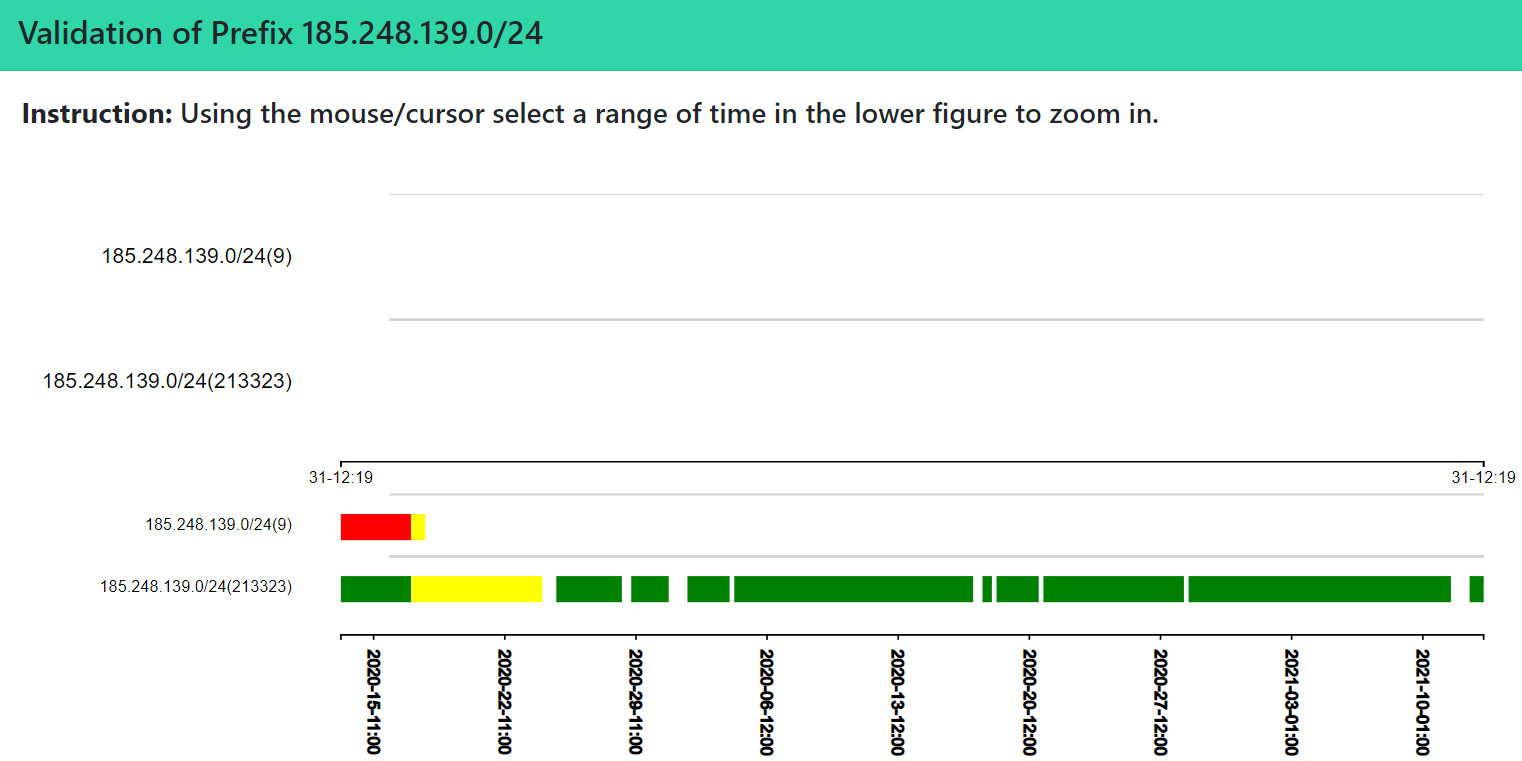
Zooming into certain sections in the main lanes (lower level) helps users improve the visibility of values in the generated chart. As a result, the corresponding section is displayed in the secondary lanes (upper level). The example below is the zooming result of the RPKI-ROV changes for the prefix shown in the image corresponding to the time window (blue box) selected in the lower lanes.
By clicking on any of the displayed boxes (green/yellow/red) in the secondary (upper) lanes, a detailed view of the selected period is provided as shown in the table below. It includes information about the RPKI-ROV status and time durations as well as information about the corresponding ROAs.
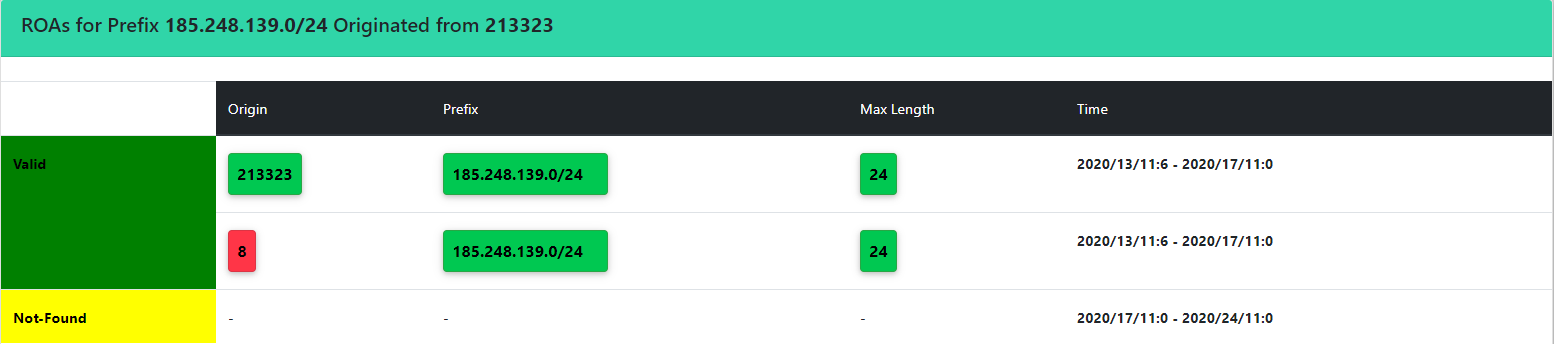
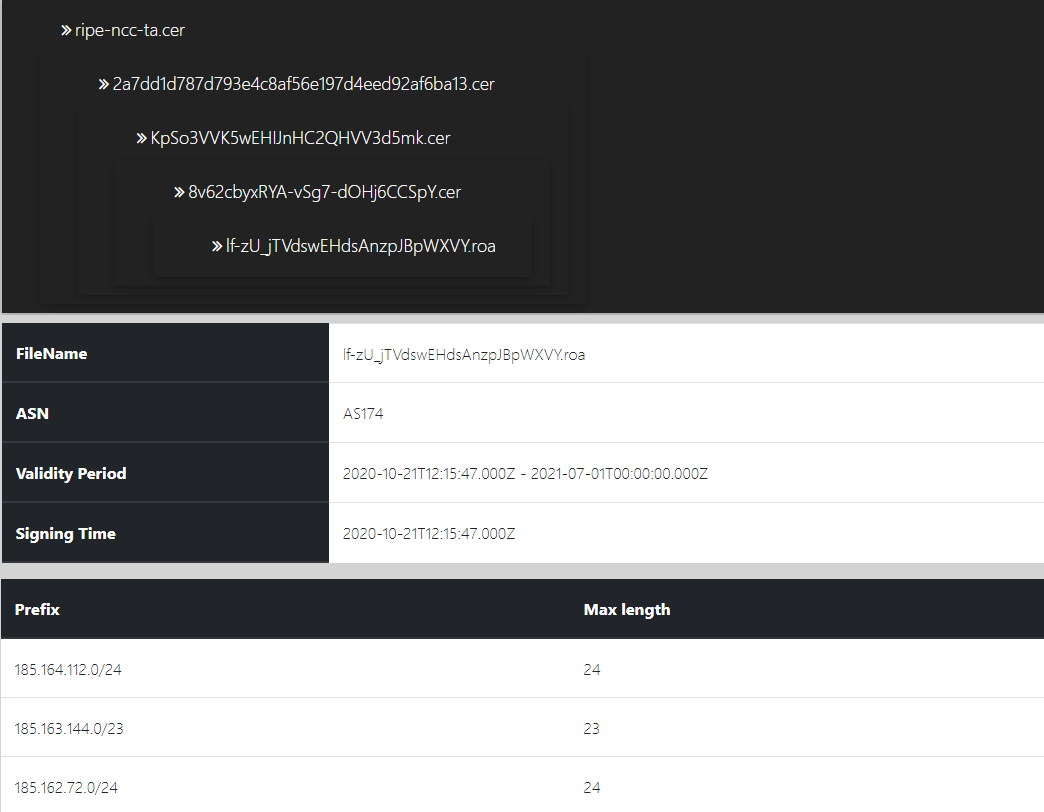
By clicking on a specific ROA prefix in the above table, the user can see more detailed information (including certificate path) about the ROA as illustrated below.
Specific Autonomous System
When the user is in the 'All Changes' tab and clicks on the origin AS number (leftmost column), then all the prefixes observed by that AS are displayed. When one of the displayed prefixes is clicked, then all the RPKI-ROV changes associated with the prefix are displayed. The details of what is displayed at this point are as described already in the above section titled "Specific Prefix" (jump to this analysis).
RPKI Data Analysis
The Monitor allows users to monitor and inspect RPKI Objects. It uses data generated by RPKI MIRO ( https://github.com/rpki-miro ).
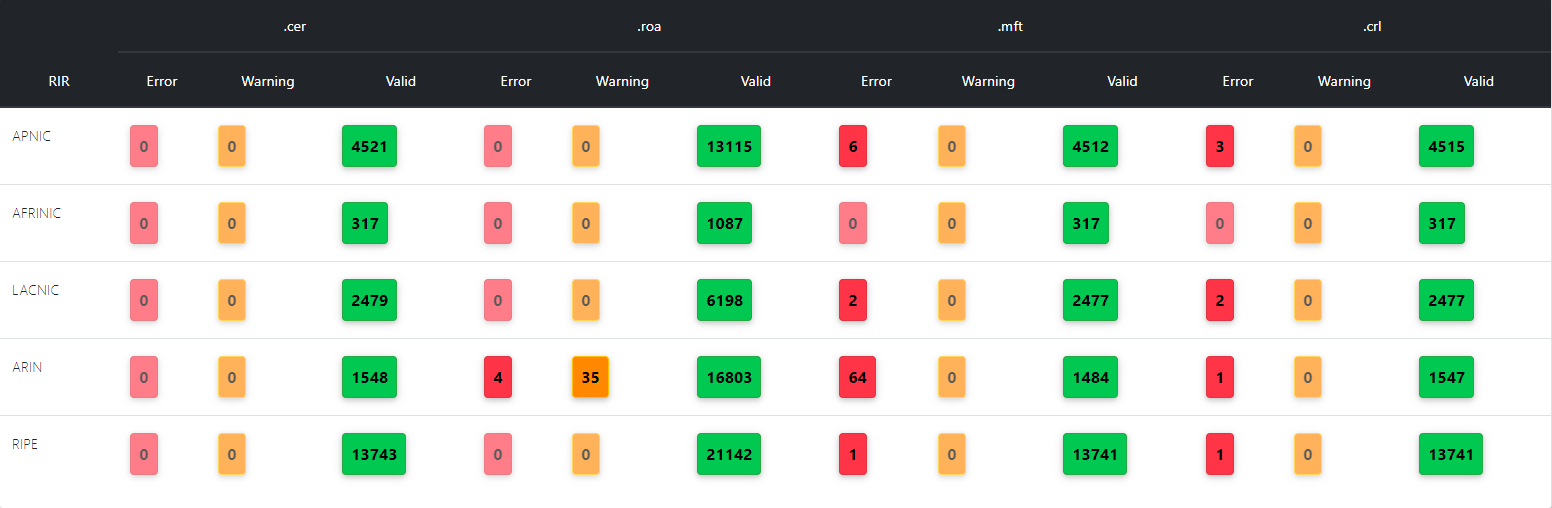
For a given RPKI object (.CER, .ROA, .MFT, .CRL), the validation can yield three different results:
- Valid: The object conforms fully to RFC specifications.
- Warning: There exists a path of valid certificate and this object is treated as valid. However, some inconsistencies with the specification exit. They are minor and not problematic from a security point of view.
- Invalid: The object considered invalid due to there is no path of valid certificates to the trust anchor, the signature on the object cannot be verified using its supposed parent certificate, the object expired.
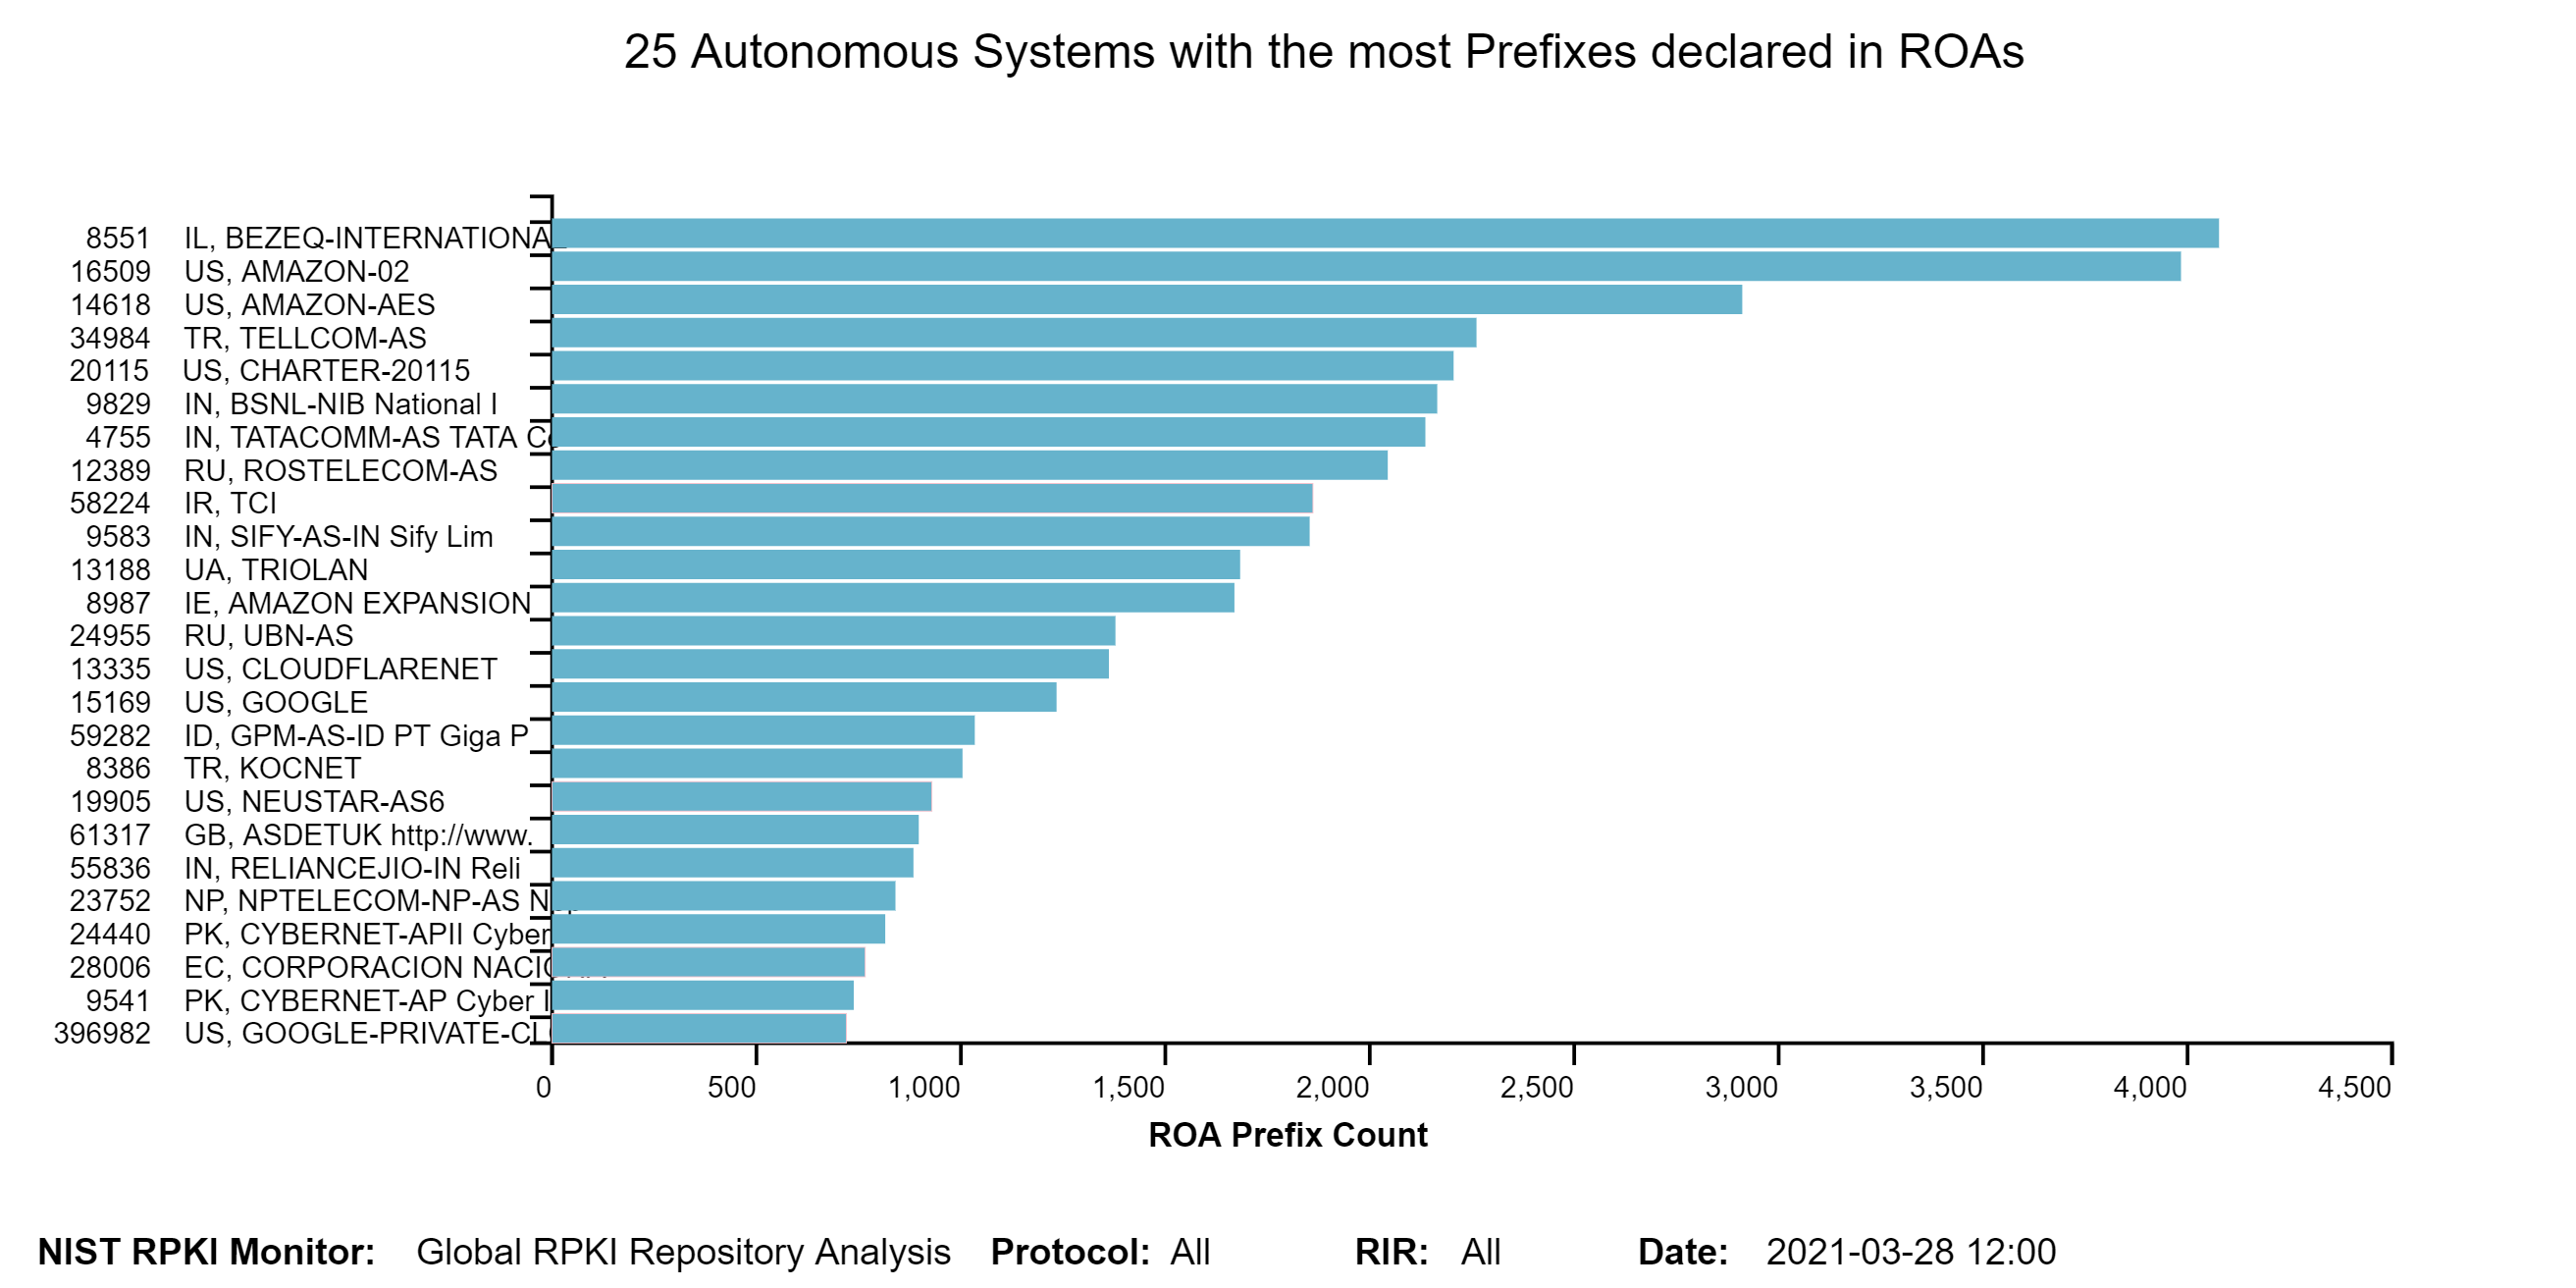
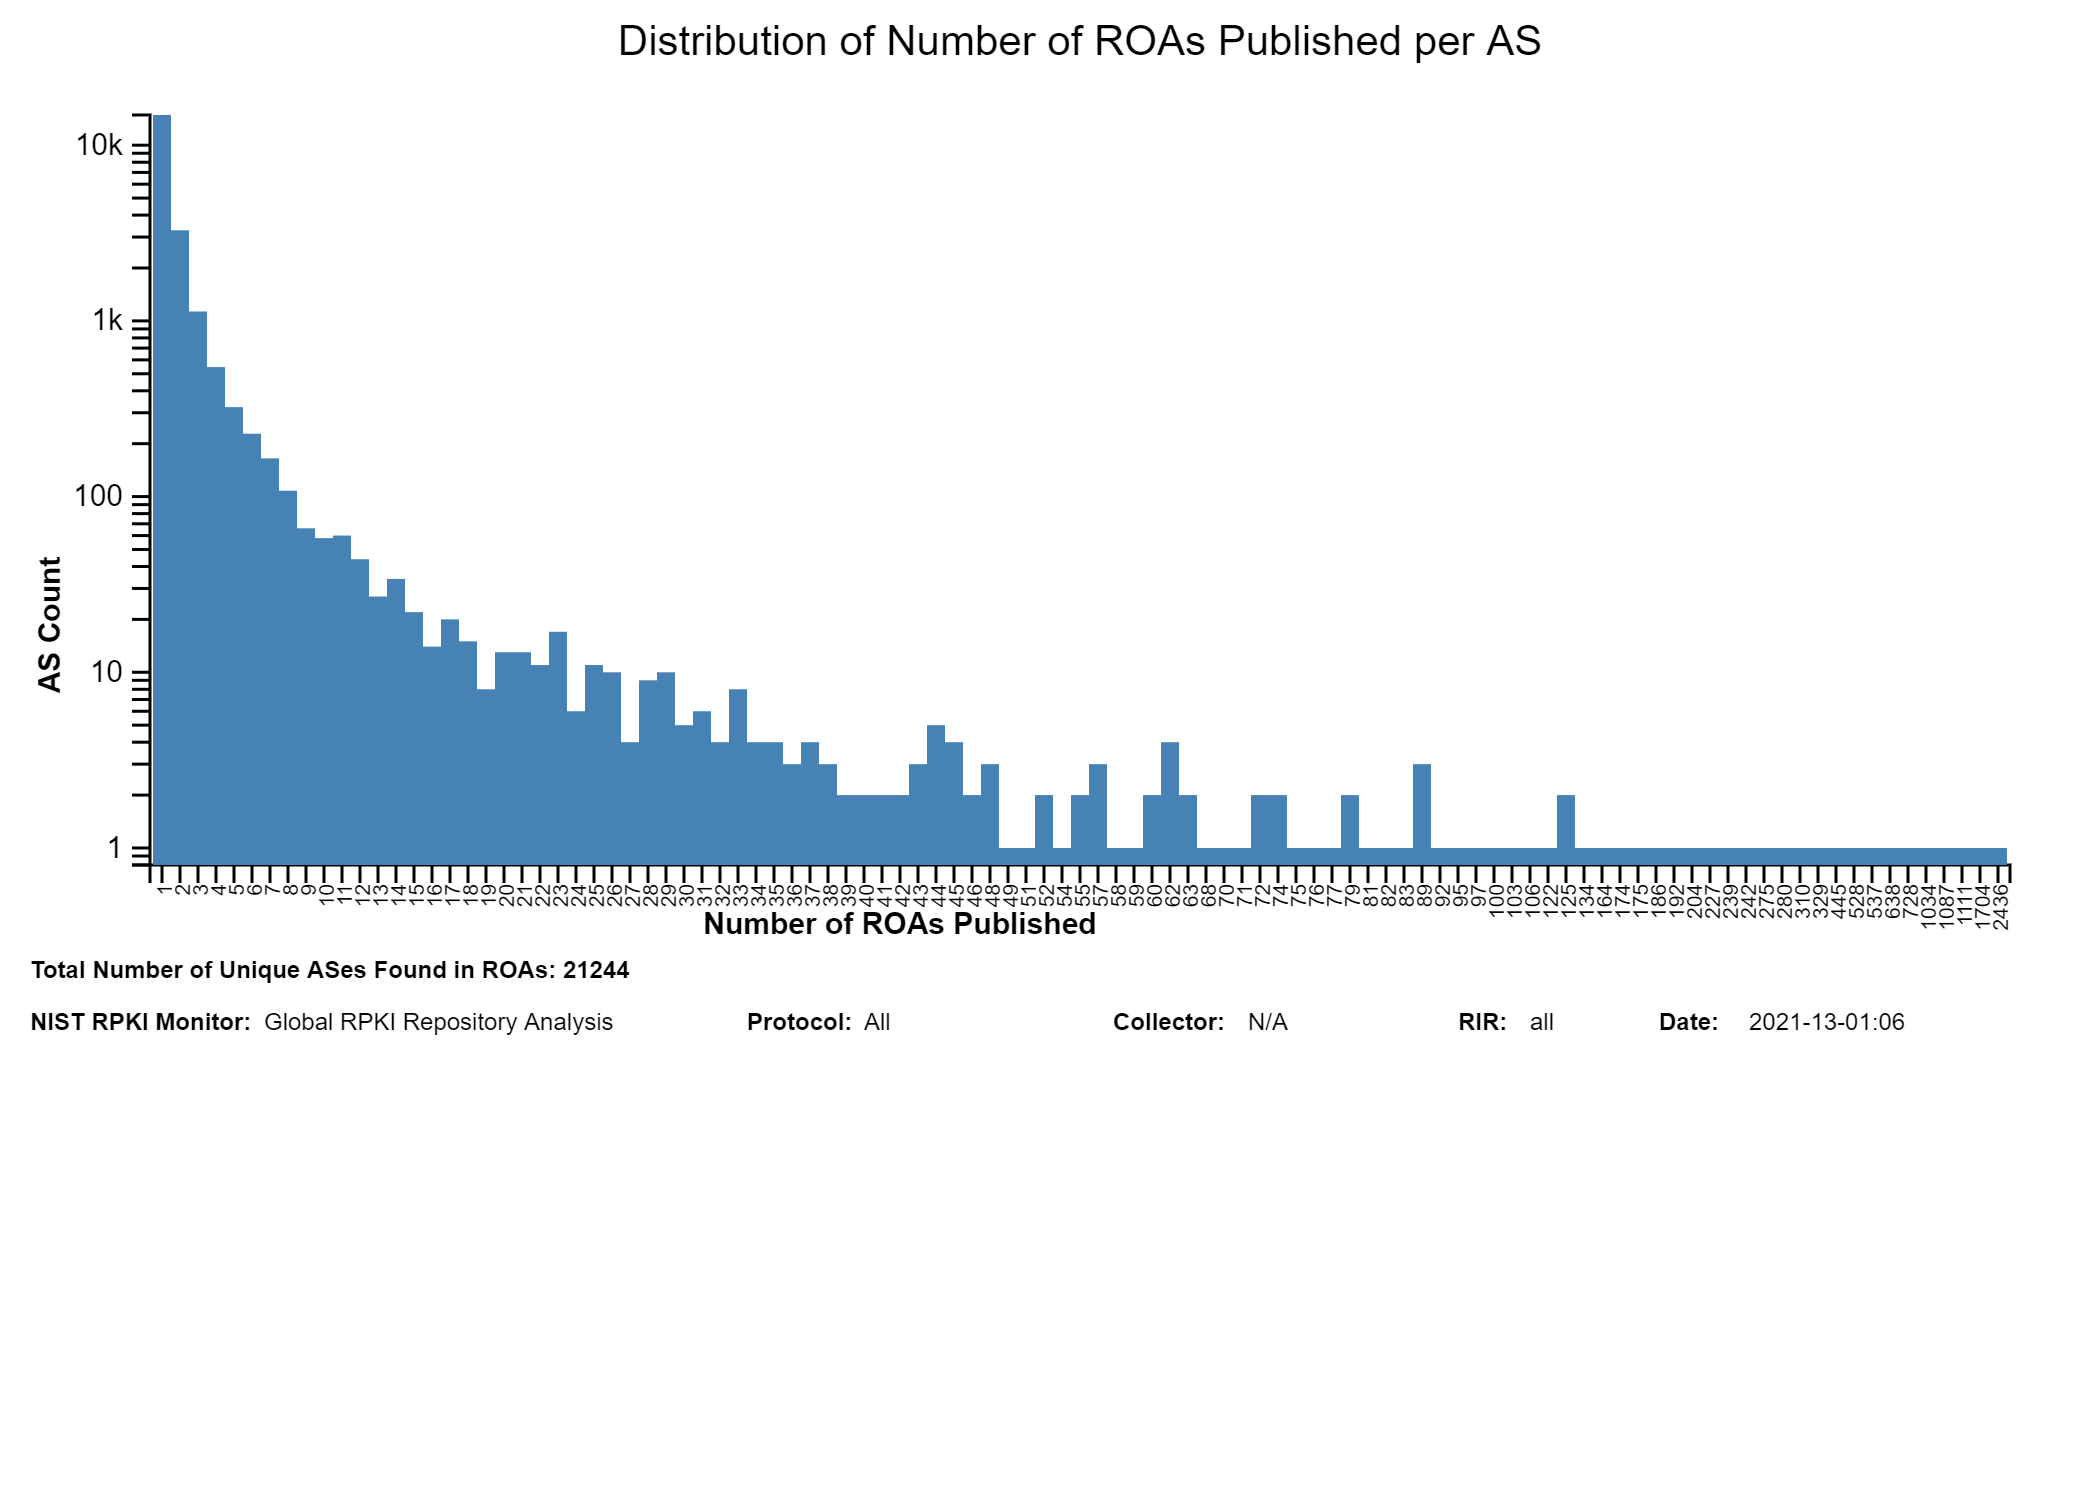
The graph below depicts the 25 Autonomous Systems with the most prefixes declared in ROAs. The vertical axis represents Autonomous System Number and organization name. The horizontal axis represents the number of Prefixes. Only X.509 Valid ROAs are considered (jump to this analysis).